
NOMAD · Phys. Lett. B 660, 19–25 (2008)
A precise measurement of the muon neutrino–nucleon inclusive charged current cross-section off an isoscalar target in the energy range 2.5 < E_ν < 40 GeV by NOMAD
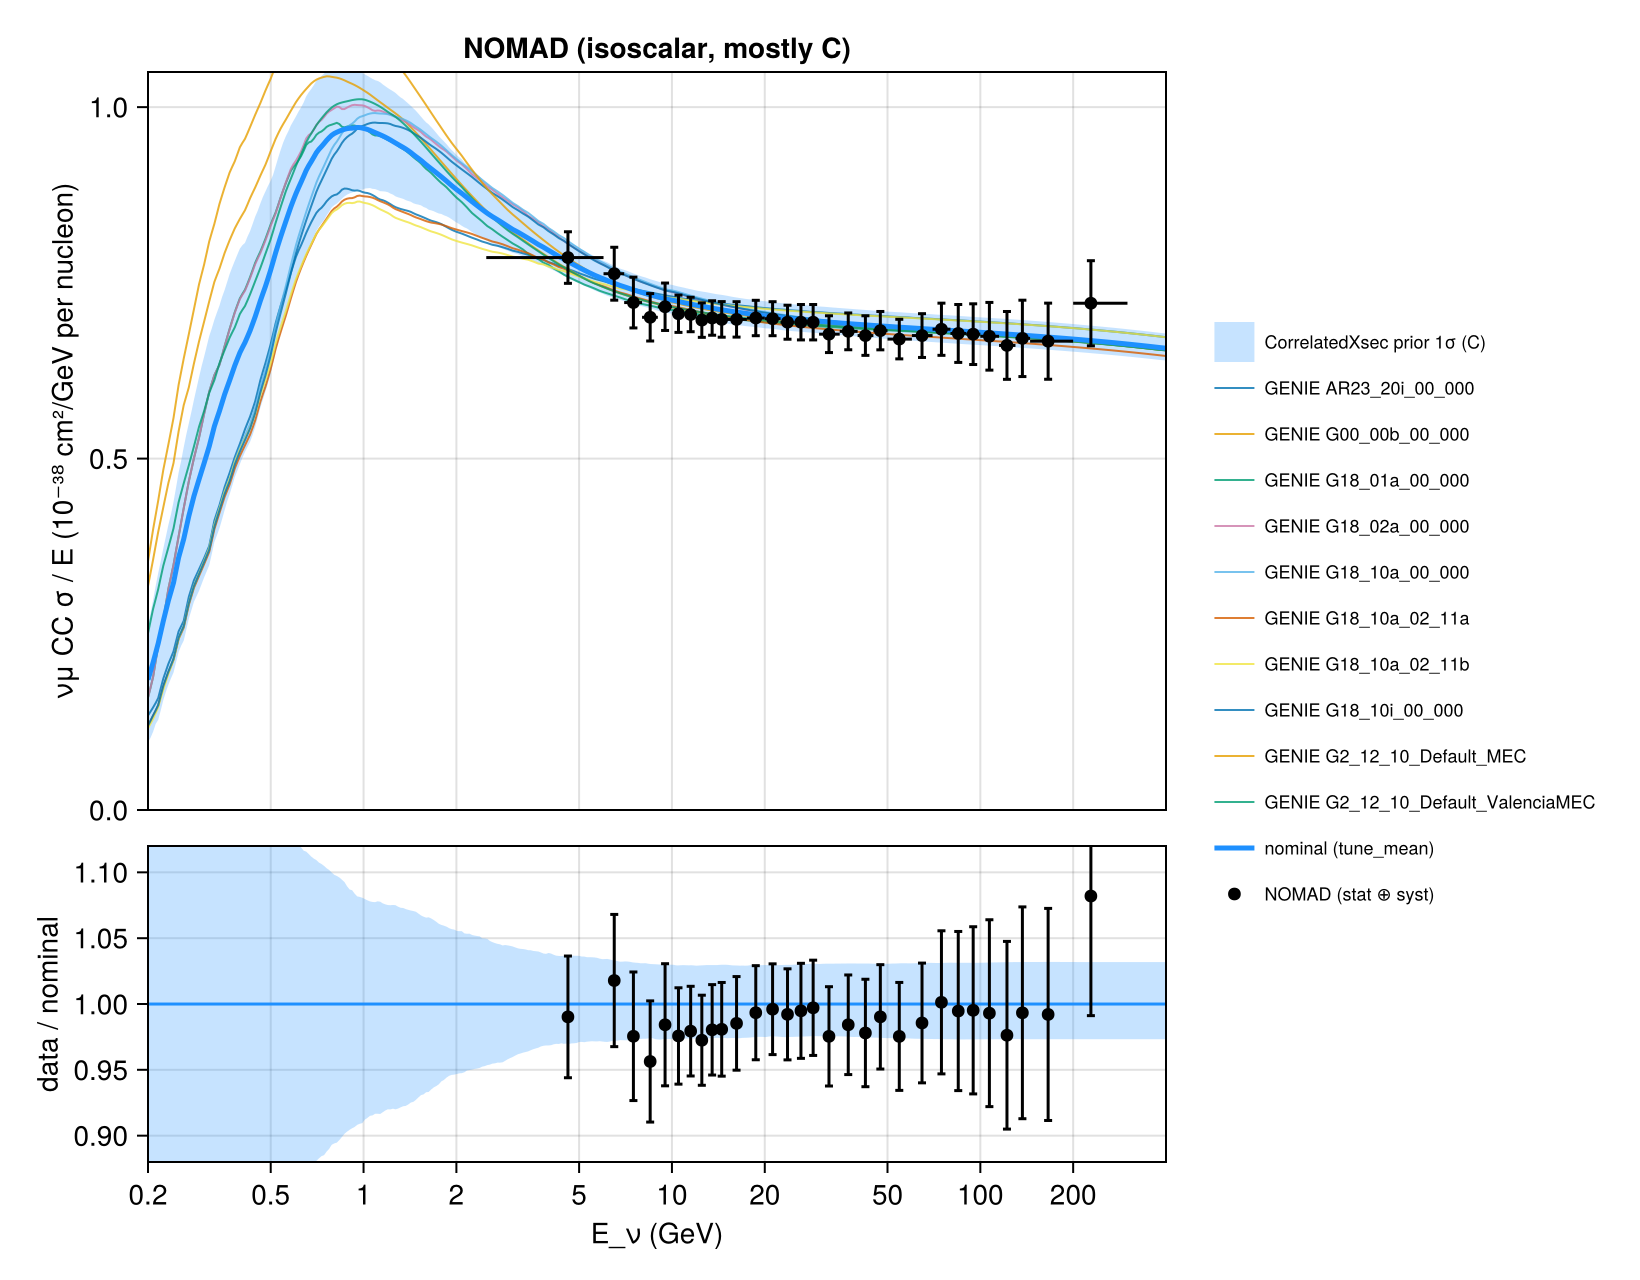
The inclusive νμ charged-current cross section per isoscalar nucleon divided by energy, 2.5–300 GeV (HEPData Table 1), compared with the cross sections carried by Newtrinos.jl (module xsec): the ten GENIE tunes of generator_sigma on carbon (NOMAD's target is mostly carbon; the result is quoted for an isoscalar nucleon) and the nominal model of CorrelatedXsec (the mean of the tunes), the cross-section model shared by all experiments in global fits, with its prior 1σ band. The nominal agrees with the data to within 1–4 % across the whole range (χ² = 6.2 for 30 bins with stat ⊕ syst errors, 4.3 with the prior band), inside its prior band (±3 % in the DIS region, ±4 % at 3 GeV). Above 20 GeV the tunes split into two groups: G18_10a_02_11a, the G18_01a/G18_02a-type tunes and GENIE 2.12 follow the data (χ² 2.9–4.8), while AR23_20i and G18_10a_02_11b lie 2–3 % higher (χ² = 15–16).
Figures
νμ CC σ/E per isoscalar nucleon: NOMAD vs the GENIE tunes and the CorrelatedXsec nominal with its prior 1σ band · Fig. 3
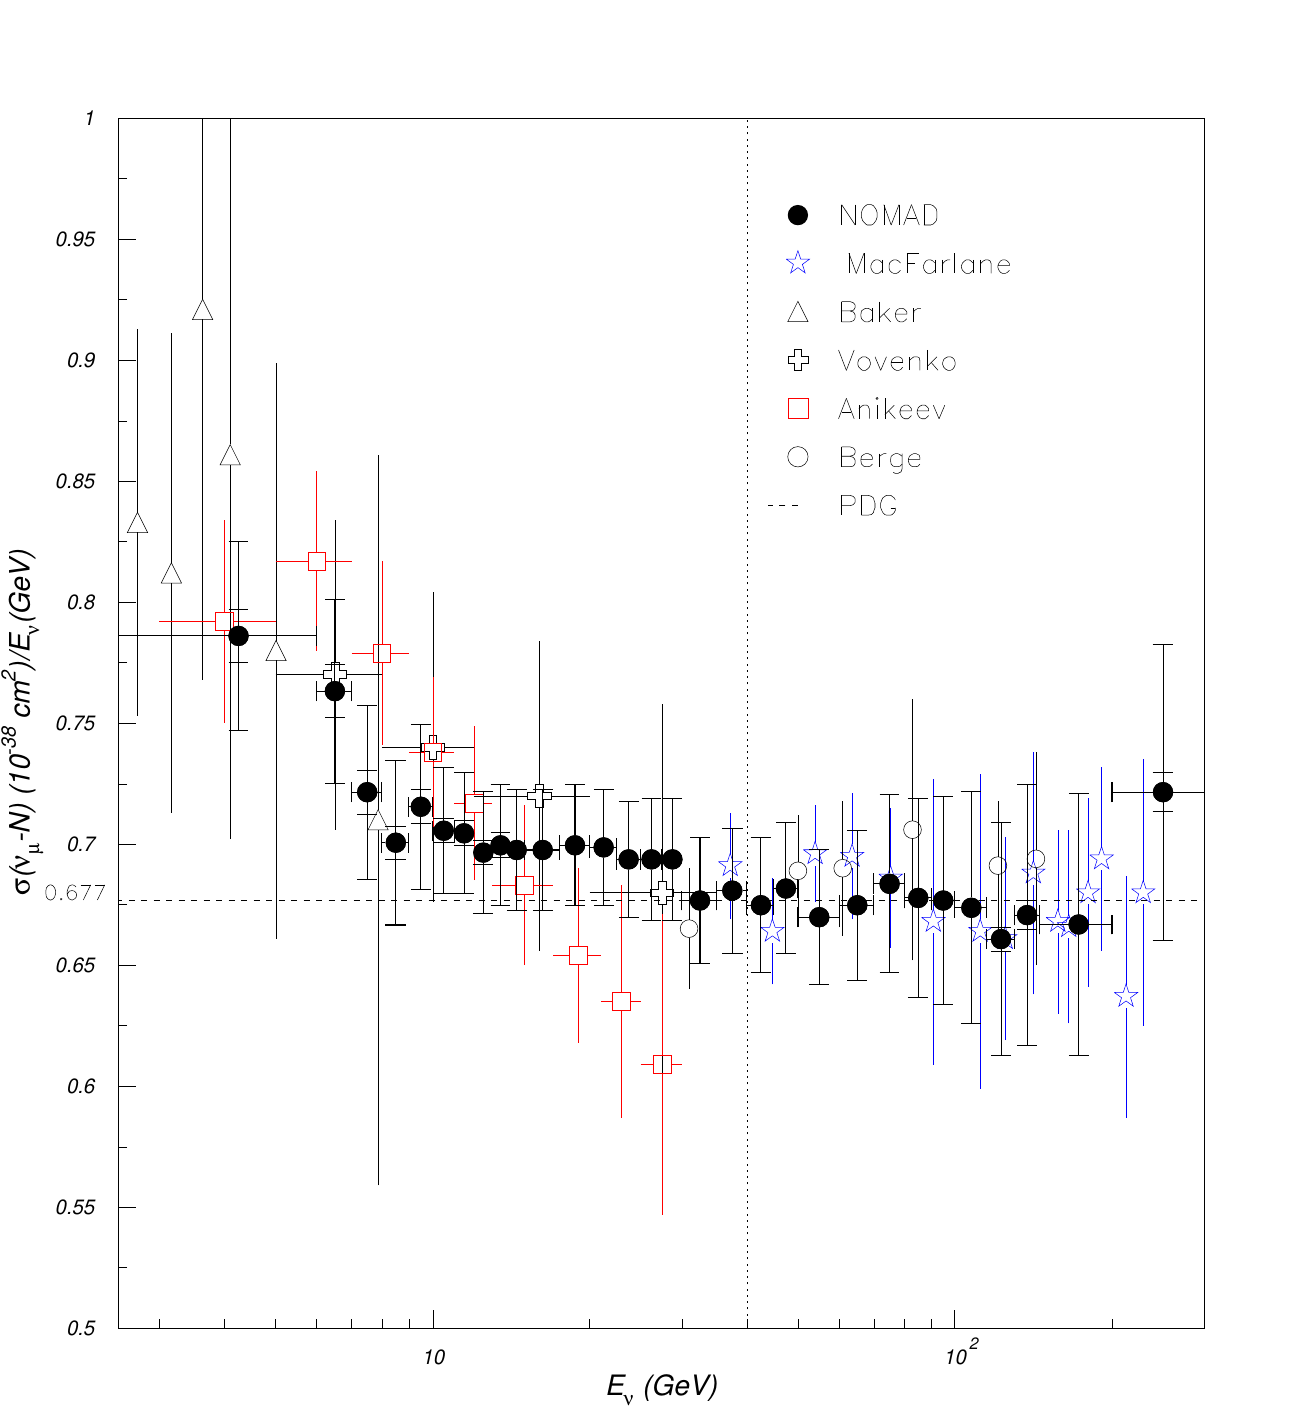
Original figure: NOMAD, Phys. Lett. B 660, 19–25 (2008), Fig. 3, doi:10.1016/j.physletb.2007.12.027. Not our work; shown for comparison, all rights with the authors and publisher.
Known limitations
- NOMAD normalised its σ/E to the world average above 40 GeV, so the absolute normalisation is not an independent test; the comparison tests the energy dependence from 2.5 to 40 GeV and, above, the agreement with the world average.
- Systematic uncertainties are largely correlated between bins (flux shape, energy scale), but no covariance is published; χ² uses stat ⊕ syst as uncorrelated errors and is therefore small. The model is averaged over each energy bin (flat in E).
- The model curves are per nucleon of ¹²C (isoscalar). NOMAD's drift-chamber target is not pure carbon; the measurement is corrected to an isoscalar nucleon.
- The prior band is the 16–84 % range of 500 draws of all CorrelatedXsec parameters from their priors.
Reproduce
git clone https://github.com/Newtrinos-org/Newtrinos.jl.git && cd Newtrinos.jl && git checkout 78e71c310b- Download reproduce.jl and the
data/folder of this entry into an empty directory. julia -t 8 --project=/path/to/Newtrinos.jl reproduce.jl
# NOMAD inclusive νμ CC cross section per isoscalar nucleon, σ/E for 2.5–300 GeV (PLB 660, 19 (2008); data from
# HEPData ins767013, Table 1), compared with the cross sections of Newtrinos.jl (module `xsec`): the GENIE tunes it
# carries (`generator_sigma`, on carbon: NOMAD's target is mostly carbon and the result is isoscalar), and the reference
# model of `CorrelatedXsec` with its prior 1σ band.
# Run from this directory with the Newtrinos.jl environment at the pinned commit:
#   julia --project=<path to Newtrinos.jl> reproduce.jl
using Newtrinos, CairoMakie, CSV, DataFrames, Printf, Statistics, Random, Distributions

cd(@__DIR__); mkpath("ours"); mkpath("results")
const X = Newtrinos.xsec

d = CSV.read("data/hepdata_ins767013_table1.csv", DataFrame; comment = "#", header = 1, delim = ",")
rename!(d, [:E, :E_lo, :E_hi, :s, :stat_p, :stat_m, :sys_p, :sys_m])
d.err = sqrt.(d.stat_p .^ 2 .+ d.sys_p .^ 2)

tab = X.load_table()
E = 10 .^ range(log10(0.2), log10(400), length = 400)   # down to the threshold region
at(v, e = E) = X.at_energies(tab.E, v, e)
TUNES = Symbol.(sort(tab.tunes))
σ_tune(t) = at(sum(X.generator_sigma(t, :C, :numu, false, :CC)))
# bin averages of σ/E over the NOMAD energy bins (flat in E within a bin)
binavg(f) = [mean(f(range(lo, hi, length = 21))) for (lo, hi) in zip(d.E_lo, d.E_hi)]

xs = X.configure(X.CorrelatedXsec())
ref = xs.cfg.reference
sig = xs.sigma(E; flavour = :numu, anti = false, current = :CC, target = :C)
sig_bins = [xs.sigma(collect(range(lo, hi, length = 21)); flavour = :numu, anti = false, current = :CC, target = :C) for (lo, hi) in zip(d.E_lo, d.E_hi)]
rng = MersenneTwister(1)
draw() = map(p -> p isa Distribution ? rand(rng, p) : p, xs.priors)
samples = [draw() for _ in 1:500]
S = reduce(hcat, [sig(p) for p in samples])
lo, hi = [quantile(r, 0.16) for r in eachrow(S)], [quantile(r, 0.84) for r in eachrow(S)]
model_bins = [mean(f(xs.params)) for f in sig_bins]
band_bins = reduce(hcat, [[mean(f(p)) for f in sig_bins] for p in samples])
σ_band_bins = [std(r) for r in eachrow(band_bins)]

fig = Figure(size = (820, 640))
ax = Axis(fig[1, 1], xscale = log10, ylabel = "νμ CC σ / E (10⁻³⁸ cm²/GeV per nucleon)", limits = (0.2, 400, 0.0, 1.05),
          xticks = ([0.2, 0.5, 1, 2, 5, 10, 20, 50, 100, 200], ["0.2", "0.5", "1", "2", "5", "10", "20", "50", "100", "200"]), title = "NOMAD (isoscalar, mostly C)")
band!(ax, E, lo, hi, color = (:dodgerblue, 0.25), label = "CorrelatedXsec prior 1σ (C)")
for (i, t) in enumerate(TUNES)
    lines!(ax, E, σ_tune(t), color = (Makie.wong_colors()[mod1(i, 7)], 0.8), linewidth = 1, label = "GENIE $(t)")
end
lines!(ax, E, sig(xs.params), color = :dodgerblue, linewidth = 2.5, label = "nominal ($(ref))")
errorbars!(ax, d.E, d.s, d.err, color = :black, whiskerwidth = 4)
errorbars!(ax, d.E, d.s, d.E .- d.E_lo, d.E_hi .- d.E, direction = :x, color = :black)
scatter!(ax, d.E, d.s, color = :black, label = "NOMAD (stat ⊕ syst)")
hidexdecorations!(ax, grid = false)
Legend(fig[1:2, 2], ax, framevisible = false, labelsize = 9)
ax2 = Axis(fig[2, 1], xscale = log10, xlabel = "E_ν (GeV)", ylabel = "data / nominal", limits = (0.2, 400, 0.88, 1.12),
           xticks = ([0.2, 0.5, 1, 2, 5, 10, 20, 50, 100, 200], ["0.2", "0.5", "1", "2", "5", "10", "20", "50", "100", "200"]))
band!(ax2, E, lo ./ sig(xs.params), hi ./ sig(xs.params), color = (:dodgerblue, 0.25))
hlines!(ax2, [1.0], color = :dodgerblue)
errorbars!(ax2, d.E, d.s ./ model_bins, d.err ./ model_bins, color = :black, whiskerwidth = 4)
scatter!(ax2, d.E, d.s ./ model_bins, color = :black)
rowsize!(fig.layout, 2, Relative(0.3))
save("ours/sigma_over_E.png", fig)

# χ² of the reference and the tunes (data errors stat ⊕ syst, uncorrelated; NOMAD normalised its σ/E to the
# world average above 40 GeV, so the normalisation is not tested), and with the model's prior band added in quadrature
chi2(m, extra = 0) = sum((d.s .- m) .^ 2 ./ (d.err .^ 2 .+ extra .^ 2))
rows = [(model = string(ref) * " (reference)", chi2 = chi2(model_bins), chi2_with_prior_band = chi2(model_bins, σ_band_bins))]
for t in TUNES
    push!(rows, (model = string(t), chi2 = chi2(binavg(e -> at(sum(X.generator_sigma(t, :C, :numu, false, :CC)), e))), chi2_with_prior_band = NaN))
end
out = DataFrame(rows)
out.ndf .= nrow(d)
CSV.write("results/chi2.csv", out)
CSV.write("results/model_bins.csv", DataFrame(E_lo = d.E_lo, E_hi = d.E_hi, data = d.s, err = d.err, reference = round.(model_bins, digits = 4),
                                               prior_1sigma = round.(σ_band_bins, digits = 4)))
show(stdout, out, allrows = true); println()
Provenance
| Newtrinos.jl commit | 78e71c310b (xsec (generator_sigma, CorrelatedXsec)) |
|---|---|
| Run date | 2026-10-12T14:45:26Z |
| Wall time | 1.6 min (4 threads) |
| Julia | 1.12.5 |
| Machine | AMD EPYC 7702P 64-Core Processor, 128 hardware threads, Linux |
| Environment | newtrinos_Manifest.toml · run.toml |
Downloads
CSV files hold one row per scan point: the scanned and profiled parameters
(sin2_theta23, dm2_32 in eV², dcp in rad, nuisance parameters), dchi2 = −2Δ log L
and the log-likelihood. JLD2 files contain the full NewtrinosResult objects.
| File | Size | SHA-256 |
|---|---|---|
| ours/sigma_over_E.png | 266.3 kB | 041deb596a5e… |
| results/chi2.csv | 523 B | 4945d3cc6e23… |
| results/model_bins.csv | 1.5 kB | 95b7b956333c… |