
P. Huber; Th. A. Mueller et al. · Phys. Rev. C 84, 024617 (2011)
Determination of antineutrino spectra from nuclear reactors
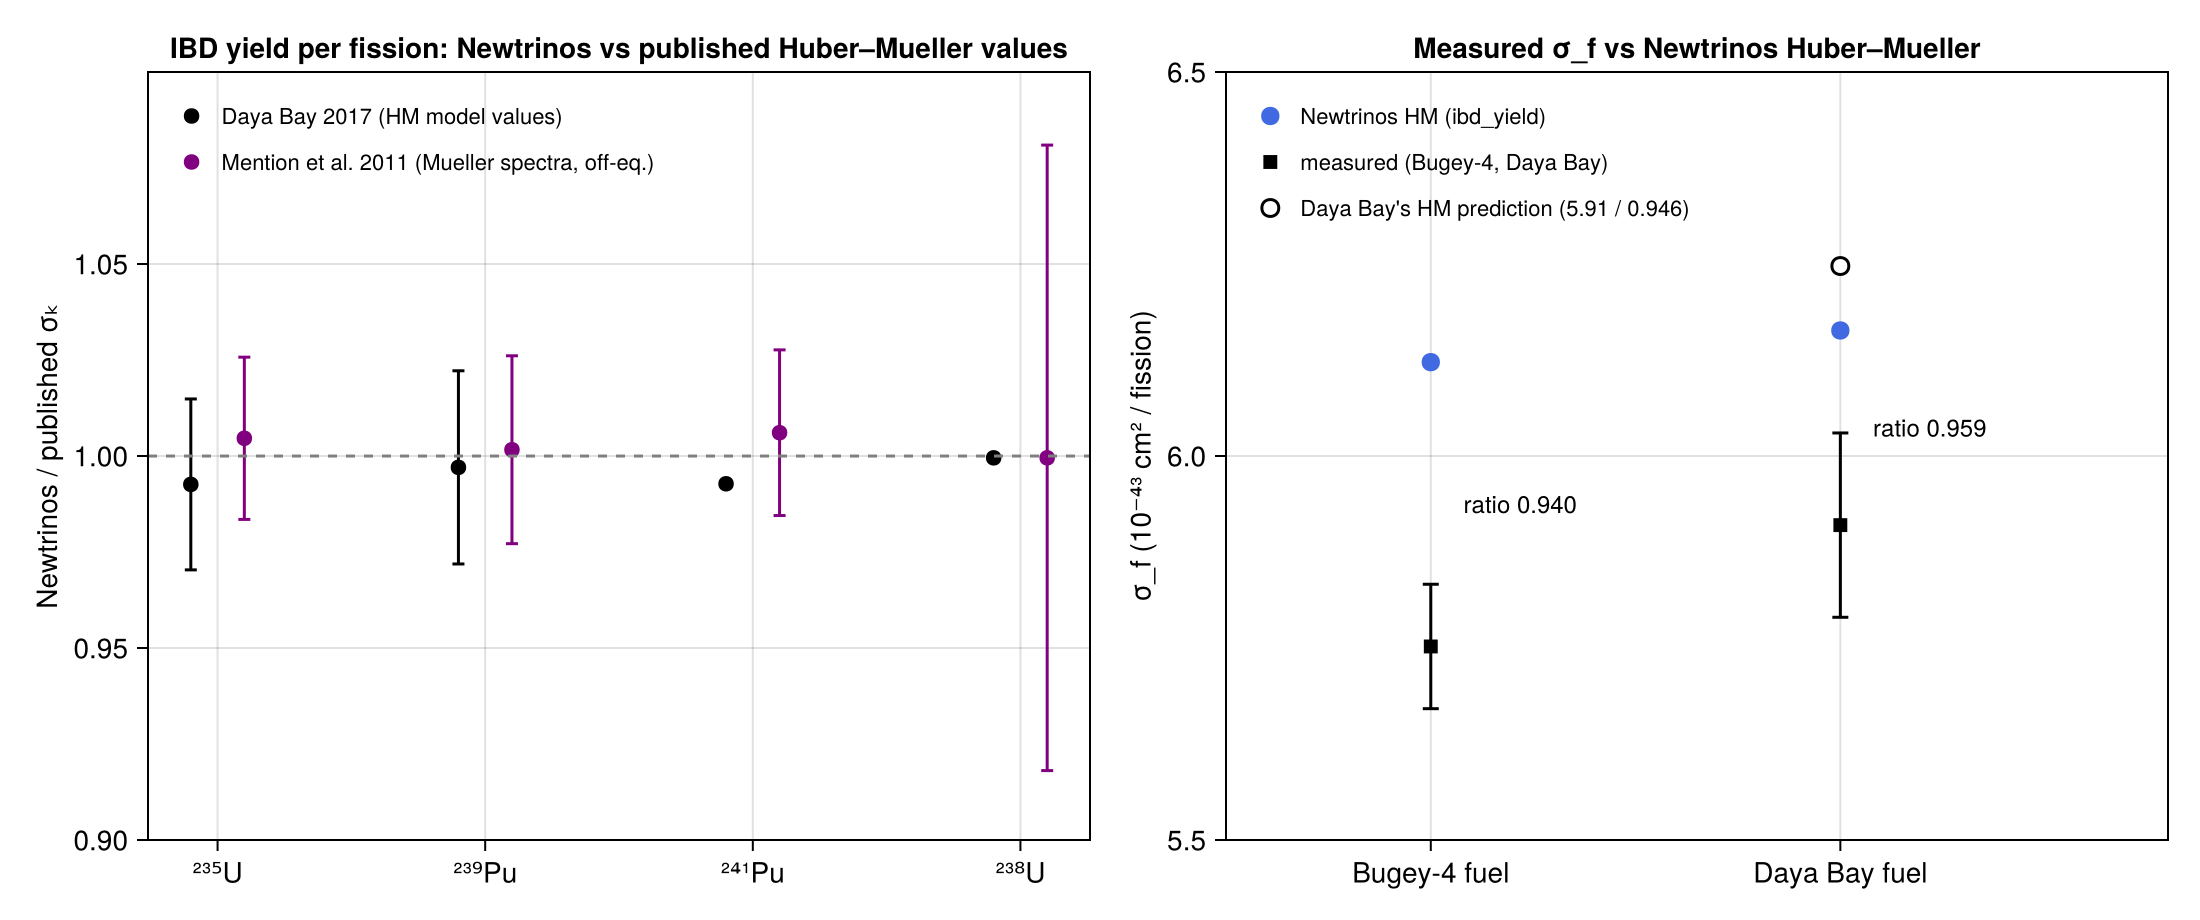
The reactor ν̄e spectra of Newtrinos.jl (module reactor_flux, the Huber–Mueller model) compared with Huber's converted spectra of ²³⁵U, ²³⁹Pu and ²⁴¹Pu (PRC 84, 024617, Tables III, VII–IX and the machine-readable files) and the ab initio ²³⁸U spectrum of Mueller et al. (PRC 83, 054615, Tables II, III and VI). Newtrinos uses the published exponential-of-polynomial coefficients unchanged. Refitting Huber's tables with his errors (stat ⊕ bias, correlated normalisation) reproduces his coefficients to all printed digits and his χ²_min (49.3, 20.8, 15.0). Within 2–7 MeV the parametrisation follows the tables to within 3 % (²³⁵U), 8 % (²⁴¹Pu) and 11 % (²³⁹Pu, one fluctuating bin), always within 1.7σ of the total error; for ²³⁸U within 5.5 % against 10–20 % errors. The IBD yields per fission (Newtrinos' Strumia–Vissani cross section, 1.806–12 MeV) are 6.64, 10.10, 4.35 and 6.01×10⁻⁴³ cm² for ²³⁵U, ²³⁸U, ²³⁹Pu and ²⁴¹Pu, within 0.7 % of the Huber–Mueller values quoted by Daya Bay (6.69, 10.1, 4.36, 6.05) and of Mention et al. (6.61, 10.10, 4.34, 5.97). The Bugey-4 anchor used for KamLAND (5.752×10⁻⁴³ cm² at 0.538 : 0.078 : 0.328 : 0.056) matches Mention et al.; Newtrinos' Huber–Mueller prediction at that fuel gives Bugey-4 / HM = 0.940 (the reactor anomaly; Mention et al.: 0.943).
Figures
Fit coefficients: Huber, Table III (Newtrinos uses them unchanged; a refit of the tables reproduces them and the χ²_min) · Huber, Table III

Original figure: P. Huber; Th. A. Mueller et al., Phys. Rev. C 84, 024617 (2011), Huber, Table III, doi:10.1103/PhysRevC.84.024617. Not our work; shown for comparison, all rights with the authors and publisher.
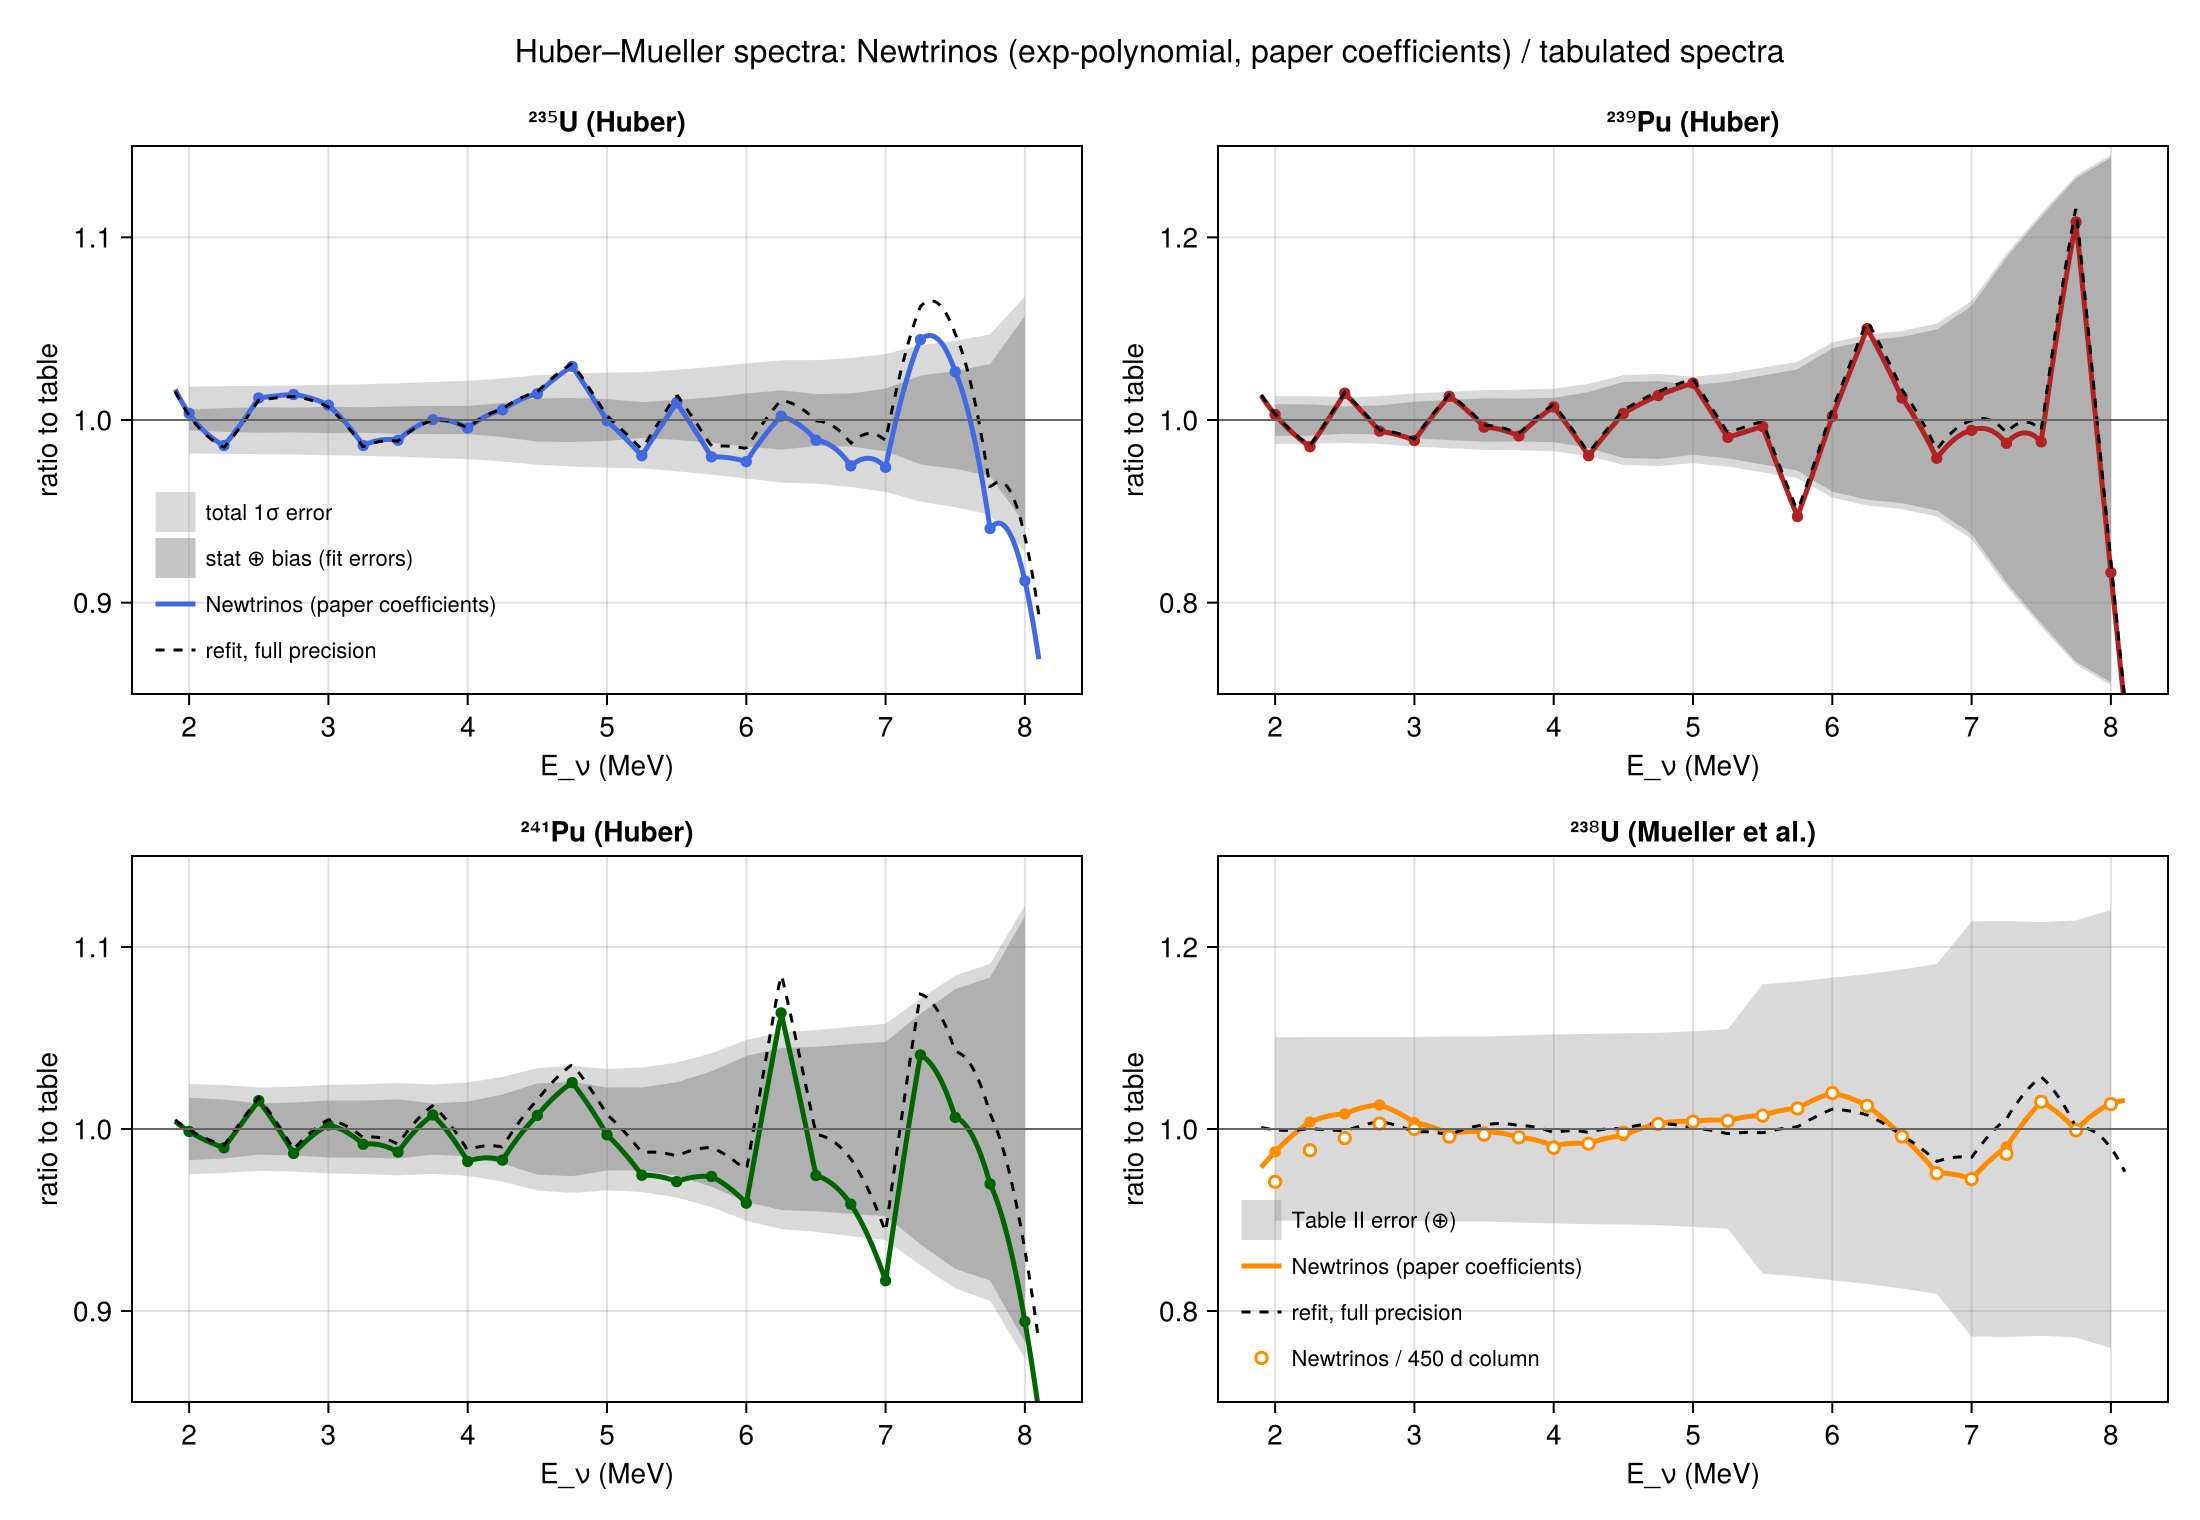
²³⁸U: Mueller et al., Table III (12 h and 450 d) vs Newtrinos, lower right panel of the spectra figure (errors from Table II) · Mueller et al., Tables II, III (coefficients: Table VI)
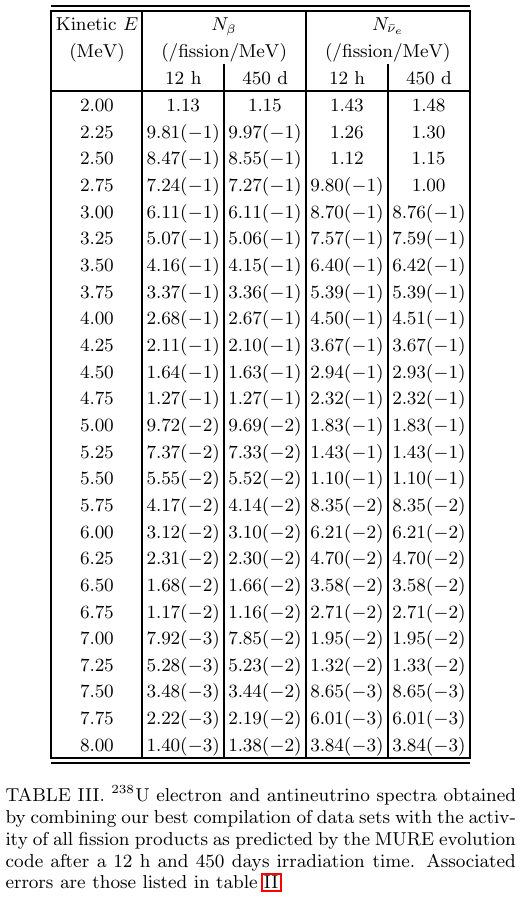
Original figure: P. Huber; Th. A. Mueller et al., Phys. Rev. C 84, 024617 (2011), Mueller et al., Tables II, III (coefficients: Table VI), doi:10.1103/PhysRevC.84.024617. Not our work; shown for comparison, all rights with the authors and publisher.
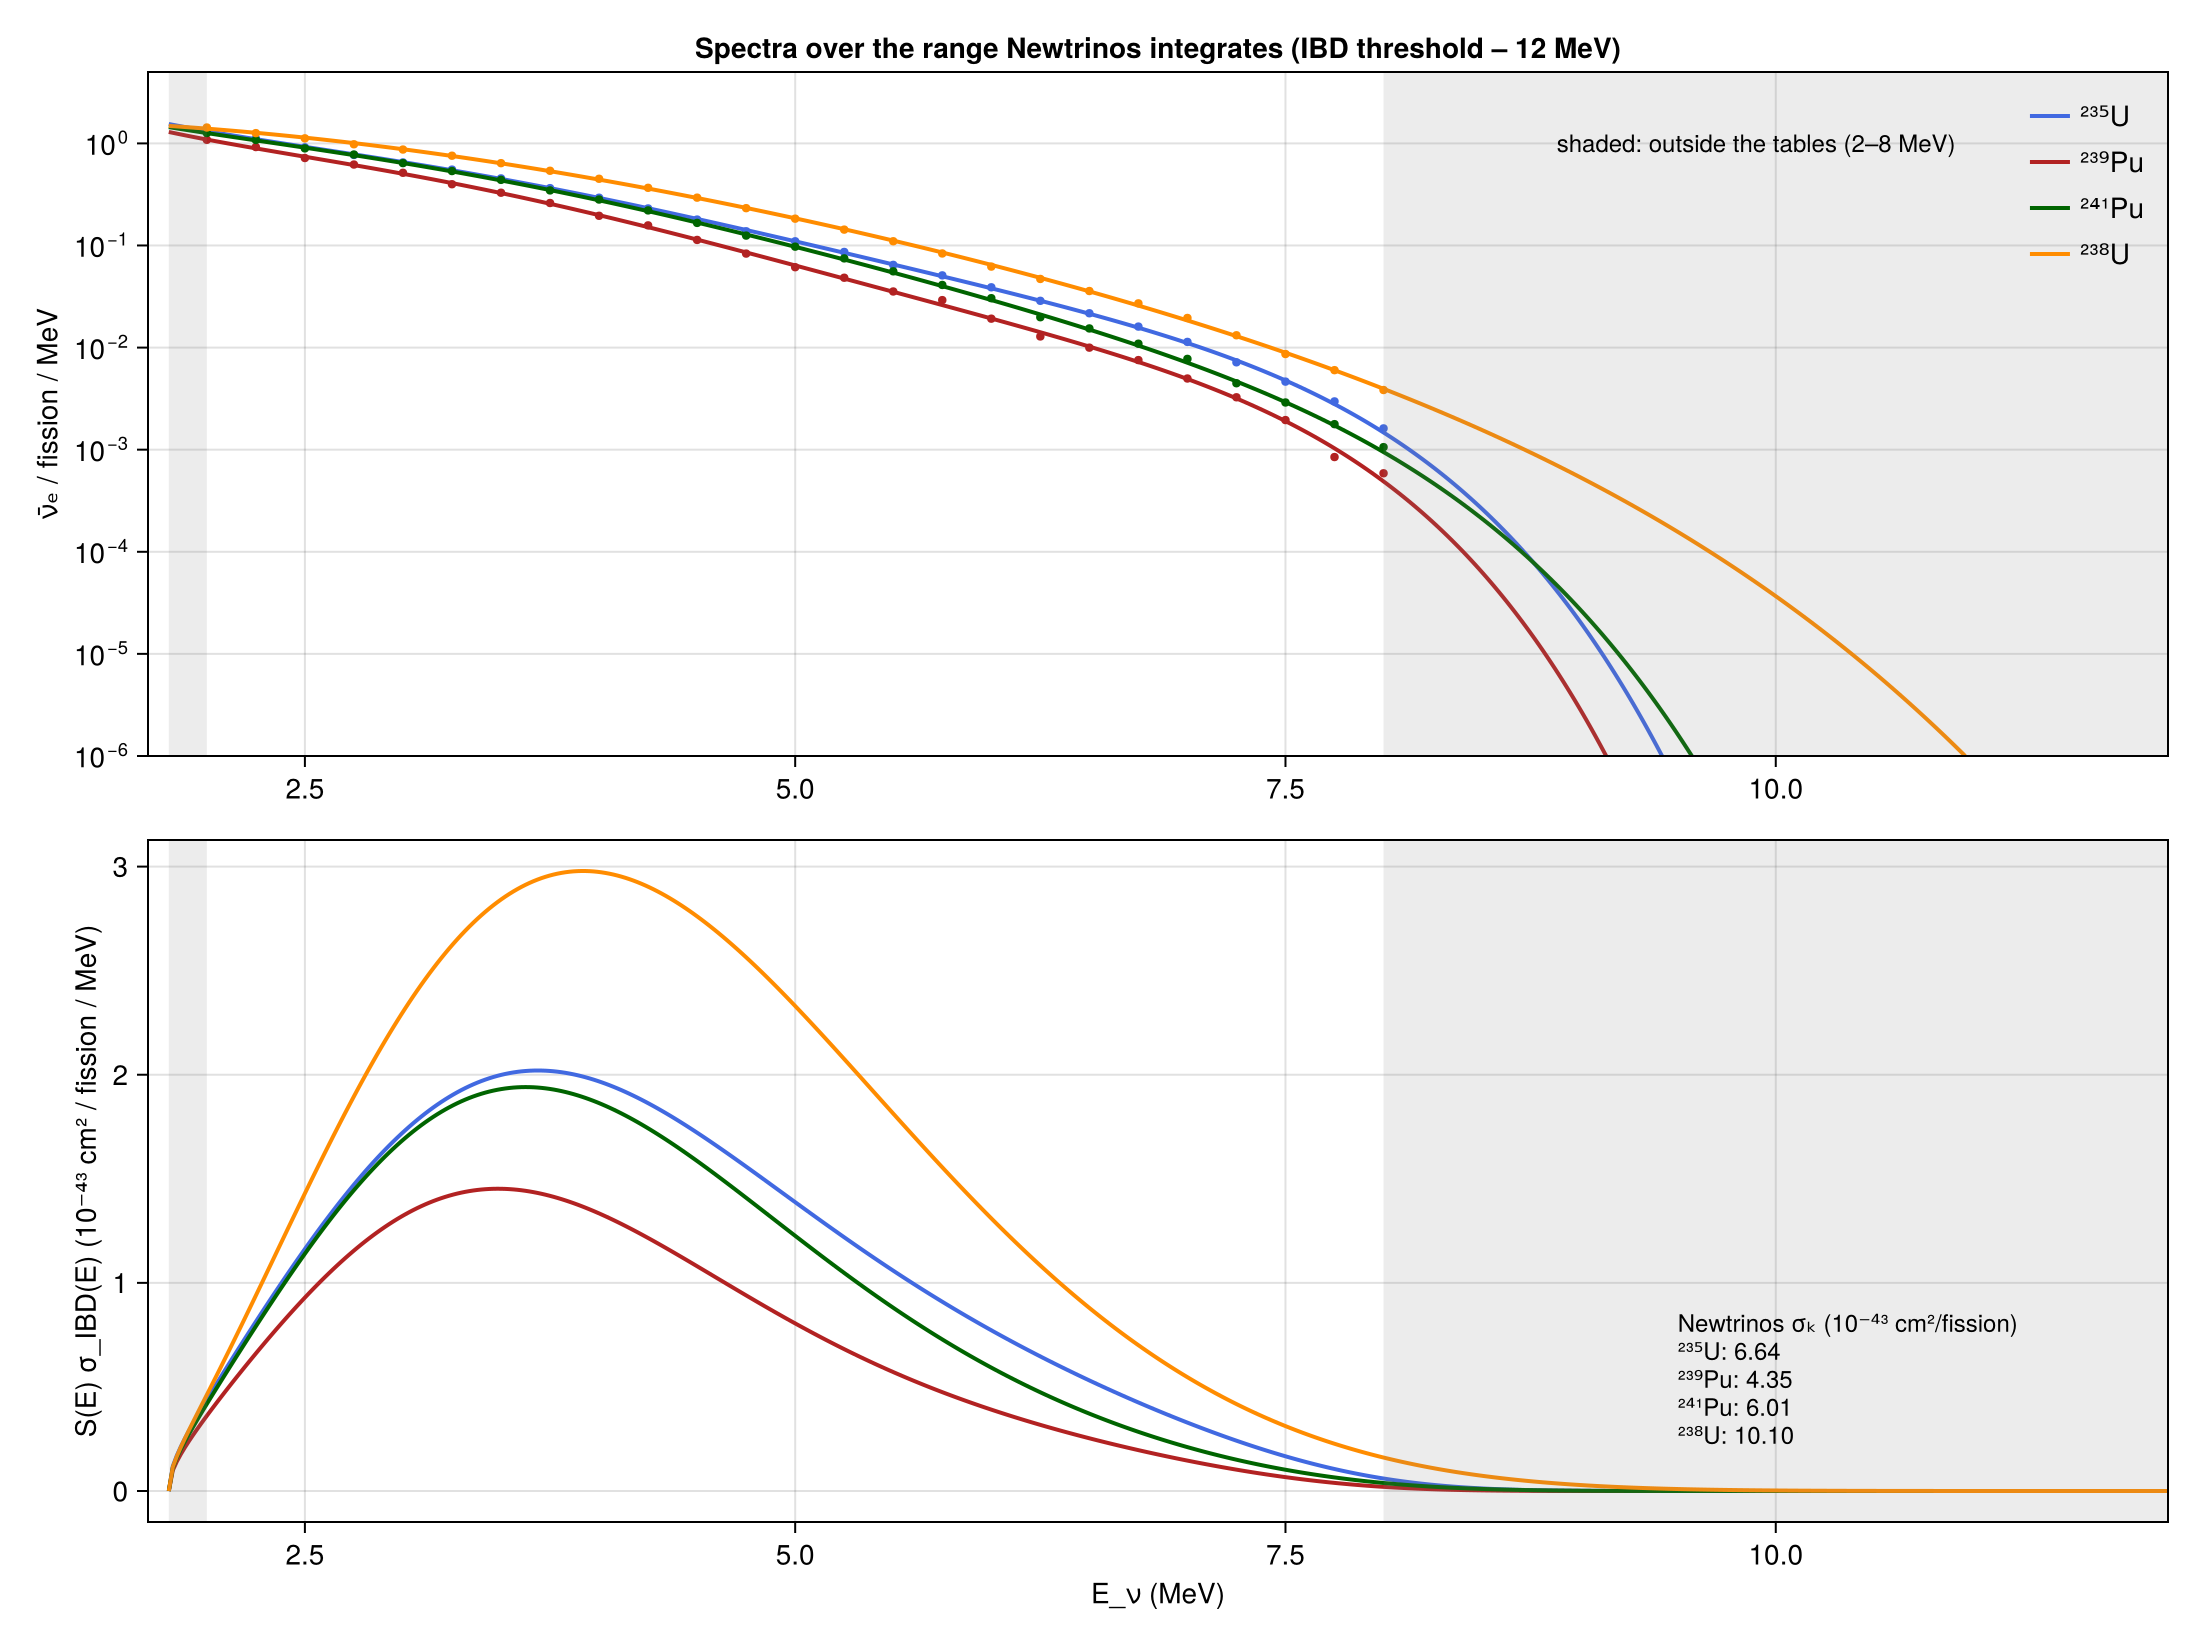
Spectra and IBD-weighted spectra over the range Newtrinos integrates, with the table points · Huber, Tables VII–IX; Mueller et al., Table III
Huber, Tables VII–IX; Mueller et al., Table III
IBD yields per fission vs published Huber–Mueller values; Bugey-4 and Daya Bay σ_f vs the Newtrinos prediction · Daya Bay PRL 118, 251801; Mention et al. Table I
Daya Bay PRL 118, 251801; Mention et al. Table I
Known limitations
- Table III of Huber prints 4 significant digits. The spectra are very sensitive to this rounding, because the coefficients are strongly correlated: the printed coefficients deviate from the full-precision fit by up to 2.6 % (²³⁵U), 1.4 % (²³⁹Pu) and 4.2 % (²⁴¹Pu), mostly above 6 MeV, and change the IBD yields by −0.2, −0.3 and −0.8 %. The rounded coefficients are what everyone uses, and the differences are within the errors. Huber himself recommends interpolating the tables rather than using the parametrisation for analyses; the table-based yields differ from Newtrinos' by at most 0.6 %.
- The ratios to the tables oscillate from bin to bin because the tabulated spectra fluctuate (the inversion has statistical scatter); the smooth parametrisation cannot follow this. The largest deviations (²³⁹Pu at 5.75 and 7.75 MeV, ²⁴¹Pu at 6.25 and 7 MeV) are single table points with 5–28 % errors.
- Mueller's ²³⁸U coefficients (Table VI) are not reproduced by a fit to their Table III, neither the 12 h nor the 450 d column (the refit has different coefficients with χ² = 0.2 against 0.5 for the published ones, using the Table II errors without correlations); the published curve still follows both columns to within 5.5 %, far inside the 10–20 % errors. The ²³⁸U errors here are the quadratic sum of Table II, with "> 20 %" entered as 20 %.
- The parametrisations stop at 2 and 8 MeV; Newtrinos integrates from the IBD threshold (1.806 MeV) to 12 MeV with the polynomial extrapolated. The extrapolated parts carry 0.5–1.0 % (below 2 MeV) and 0.1–0.9 % (above 8 MeV, largest for ²³⁸U) of the IBD yields.
- The spectra are those of short irradiation (12 h for ²³⁵U and ²³⁸U, 36–43 h for Pu, as at the ILL). Newtrinos' reactor_flux has no off-equilibrium or spent-fuel correction (Mueller et al. Table VII: +1–2 % below 3 MeV, about +1 % on σ_f); the KamLAND module adds a constant factor 1.007. This is why Daya Bay's Huber–Mueller prediction at its fuel (5.91 / 0.946 = 6.25) is 1.4 % above Newtrinos' 6.16; Daya Bay's isotope values alone give 6.20 (−0.6 %).
- The IBD yields depend on the cross section, which is Newtrinos' Strumia–Vissani approximation (checked in its own entry); the published yields used different cross sections and neutron lifetimes, which accounts for differences at the few-per-mille level.
Reproduce
git clone https://github.com/Newtrinos-org/Newtrinos.jl.git && cd Newtrinos.jl && git checkout c69601ed6d- Download reproduce.jl and the
data/folder of this entry into an empty directory. julia -t 8 --project=/path/to/Newtrinos.jl reproduce.jl
# Verification of the Newtrinos.jl reactor ν̄e spectra (module `reactor_flux`, the Huber–Mueller model) against
# Huber, PRC 84, 024617 (2011) (²³⁵U, ²³⁹Pu, ²⁴¹Pu: Table III fit coefficients, Tables VII–IX / machine-readable spectra)
# and Mueller et al., PRC 83, 054615 (2011) (²³⁸U: Table III spectrum, Table II errors, Table VI fit coefficients),
# and of the IBD yields per fission against published Huber–Mueller values.
# Run from this directory with the Newtrinos.jl environment at the pinned commit:
#   julia --project=<path to Newtrinos.jl> reproduce.jl
using Newtrinos, CairoMakie, DelimitedFiles, LinearAlgebra, Printf

cd(@__DIR__); mkpath("ours"); mkpath("results")

const RF = Newtrinos.reactor_flux
const ISOS = (:U235, :Pu239, :Pu241, :U238)
const LABEL = Dict(:U235 => "²³⁵U", :U238 => "²³⁸U", :Pu239 => "²³⁹Pu", :Pu241 => "²⁴¹Pu")
const COLOR = Dict(:U235 => :royalblue, :U238 => :darkorange, :Pu239 => :firebrick, :Pu241 => :darkgreen)

# linear interpolation in ln S between the table points (for the ratio curves and the table-based yields)
function RF_interp(X, Y, x)
    i = clamp(searchsortedlast(X, x), 1, length(X) - 1)
    Y[i] + (x - X[i]) / (X[i+1] - X[i]) * (Y[i+1] - Y[i])
end
poly(a, E) = exp(sum(a[p] * E^(p - 1) for p in 1:6))
design(E) = [e^(p - 1) for e in E, p in 1:6]

# ------------------------------------------------------------------------------------------------
# inputs: Huber's machine-readable spectra (relative errors), Mueller's ²³⁸U table, published coefficients
# ------------------------------------------------------------------------------------------------
function huber(iso)
    d = readdlm("data/huber_$(iso).dat", comments = true)
    (E = d[:, 1], S = d[:, 2], stat = d[:, 4], bias = d[:, 6], norm = d[:, 12], lo = -d[:, 13], hi = d[:, 14])
end
tab = Dict{Symbol, Any}(iso => huber(iso) for iso in (:U235, :Pu239, :Pu241))
m, _ = readdlm("data/mueller_u238.csv", ',', Float64, header = true, comments = true)
err238 = sqrt.(sum(m[:, 4:7] .^ 2, dims = 2))[:] ./ 100
tab[:U238] = (E = m[:, 1], S = m[:, 2], S450 = m[:, 3], lo = err238, hi = err238)

c, hc = readdlm("data/fit_coefficients.csv", ',', header = true, comments = true)
published = Dict(Symbol(c[i, 1]) => Float64.(c[i, 3:8]) for i in 1:size(c, 1))

# ------------------------------------------------------------------------------------------------
# 1. coefficients: Newtrinos vs the papers, and a refit to the tabulated spectra
# ------------------------------------------------------------------------------------------------
# Huber fits ln S with the uncorrelated (stat ⊕ bias) errors plus the fully correlated normalisation error (Z̄ and weak
# magnetism left out, Sec. IV); the fit is linear in the coefficients, so it is solved exactly (generalised least squares).
function gls(E, y, V)
    X = design(E); W = inv(V)
    a = (X' * W * X) \ (X' * W * y)
    r = X * a .- y
    a, r' * W * r
end
chi2(a, E, y, V) = (r = log.(poly.(Ref(a), E)) .- y; r' * inv(V) * r)
covariance(iso) = iso == :U238 ? Matrix(Diagonal(err238 .^ 2)) :
                  (t = tab[iso]; Matrix(Diagonal(t.stat .^ 2 .+ t.bias .^ 2)) .+ t.norm * t.norm')

refit = Dict{Symbol, Vector{Float64}}()
io = open("results/coefficients.csv", "w")
println(io, "isotope,source,a1,a2,a3,a4,a5,a6,chi2")
println("Polynomial coefficients:")
for iso in ISOS
    t = tab[iso]; V = covariance(iso); y = log.(t.S)
    a_nt = collect(RF.HM_COEFFS[iso])
    a_fit, χ²_fit = gls(t.E, y, V)
    refit[iso] = a_fit
    @printf("  %-5s Newtrinos == paper: %s   χ²(Newtrinos coefficients) = %5.1f   refit χ²_min = %5.1f   refit: %s\n", iso,
            a_nt == published[iso], chi2(a_nt, t.E, y, V), χ²_fit, join((@sprintf("%.5g", x) for x in a_fit), ", "))
    for (src, a, χ²) in (("newtrinos", a_nt, chi2(a_nt, t.E, y, V)), ("paper", published[iso], chi2(published[iso], t.E, y, V)),
                         ("refit", a_fit, χ²_fit))
        println(io, iso, ",", src, ",", join(a, ","), ",", @sprintf("%.3f", χ²))
    end
end
close(io)

# ------------------------------------------------------------------------------------------------
# Fig. 1: Newtrinos spectra relative to the tabulated spectra
# ------------------------------------------------------------------------------------------------
io = open("results/spectra.csv", "w")
println(io, "isotope,E_MeV,table,newtrinos,ratio,err_lo,err_hi,refit_ratio")
fig = Figure(size = (1100, 760))
println("\nNewtrinos / tabulated spectrum, 2–8 MeV:")
for (k, iso) in enumerate(ISOS)
    t = tab[iso]
    ax = Axis(fig[(k - 1) ÷ 2 + 1, (k - 1) % 2 + 1], title = LABEL[iso] * (iso == :U238 ? " (Mueller et al.)" : " (Huber)"),
              xlabel = "E_ν (MeV)", ylabel = "ratio to table", xticks = 2:8)
    band!(ax, t.E, 1 .- t.lo, 1 .+ t.hi, color = (:gray, 0.3), label = iso == :U238 ? "Table II error (⊕)" : "total 1σ error")
    if iso != :U238
        band!(ax, t.E, 1 .- sqrt.(t.stat .^ 2 .+ t.bias .^ 2), 1 .+ sqrt.(t.stat .^ 2 .+ t.bias .^ 2), color = (:gray, 0.45),
              label = "stat ⊕ bias (fit errors)")
    end
    Ef = range(1.9, 8.1, length = 300)
    tl(E) = exp(RF_interp(t.E, log.(t.S), E))
    nt = [RF.isotope_spectrum(iso, e) for e in t.E]
    lines!(ax, Ef, [RF.isotope_spectrum(iso, e) / tl(e) for e in Ef], color = COLOR[iso], linewidth = 2.5, label = "Newtrinos (paper coefficients)")
    scatter!(ax, t.E, nt ./ t.S, color = COLOR[iso], markersize = 8)
    lines!(ax, Ef, [poly(refit[iso], e) / tl(e) for e in Ef], color = :black, linestyle = :dash, linewidth = 1.5,
           label = "refit, full precision")
    if iso == :U238
        scatter!(ax, t.E, nt ./ t.S450, color = :white, strokecolor = COLOR[iso], strokewidth = 1.5, markersize = 8,
                 label = "Newtrinos / 450 d column")
    end
    hlines!(ax, [1.0], color = :gray40, linewidth = 1)
    ylims!(ax, iso == :U238 || iso == :Pu239 ? (0.7, 1.3) : (0.85, 1.15))
    r = nt ./ t.S .- 1
    inner = 2.0 .<= t.E .<= 7.0
    # for Huber the refit reproduces Table III up to its 4 printed digits, so Newtrinos / refit is the effect of that rounding;
    # Mueller's ²³⁸U coefficients do not come from a fit to Table III (see the caveats), so there it is a different fit
    @printf("  %-5s max |Δ| = %4.1f %% (2–7 MeV: %4.1f %%), max |Δ|/σ_tot = %.2f; refit max |Δ| = %4.1f %%; Newtrinos / refit: max %4.1f %% (2–6 MeV %4.1f %%)\n",
            iso, 100maximum(abs.(r)), 100maximum(abs.(r[inner])), maximum(abs.(r) ./ ((t.lo .+ t.hi) ./ 2)),
            100maximum(abs.(poly.(Ref(refit[iso]), t.E) ./ t.S .- 1)),
            100maximum(abs.(nt ./ poly.(Ref(refit[iso]), t.E) .- 1)),
            100maximum(abs.((nt ./ poly.(Ref(refit[iso]), t.E) .- 1)[t.E .<= 6.0])))
    for i in eachindex(t.E)
        @printf(io, "%s,%.2f,%.6e,%.6e,%.5f,%.5f,%.5f,%.5f\n", iso, t.E[i], t.S[i], nt[i], nt[i] / t.S[i], t.lo[i], t.hi[i],
                poly(refit[iso], t.E[i]) / t.S[i])
    end
    k == 1 && axislegend(ax, position = :lb, framevisible = false, labelsize = 11)
    iso == :U238 && axislegend(ax, position = :lb, framevisible = false, labelsize = 11)
end
close(io)
Label(fig[0, :], "Huber–Mueller spectra: Newtrinos (exp-polynomial, paper coefficients) / tabulated spectra", fontsize = 16)
save("ours/spectra.png", fig)

# ------------------------------------------------------------------------------------------------
# Fig. 2 and yields: the full energy range used by Newtrinos (IBD threshold – 12 MeV)
# ------------------------------------------------------------------------------------------------
# IBD yield per fission with Newtrinos' cross section: S = table (linear interpolation, Huber's recommendation) in 2–8 MeV,
# the polynomial outside (as for Newtrinos)
function yield(S; lo = RF.IBD_THRESHOLD, hi = 12.0, n = 20000)
    E = range(lo, hi, length = n + 1); h = step(E)
    h * sum((k == 1 || k == n + 1 ? 0.5 : 1.0) * S(e) * RF.ibd_xsec(e) for (k, e) in enumerate(E))
end
one_iso(iso) = NamedTuple{RF.ISOTOPES}(Tuple(Float64(j == iso) for j in RF.ISOTOPES))
pub, _ = readdlm("data/published_yields.csv", ',', header = true, comments = true)
pubv(row, iso) = Float64(pub[row, 2 + 2 * (findfirst(==(iso), (:U235, :U238, :Pu239, :Pu241)) - 1)])
puberr(row, iso) = (v = pub[row, 3 + 2 * (findfirst(==(iso), (:U235, :U238, :Pu239, :Pu241)) - 1)]; v == "" ? NaN : Float64(v))

fig = Figure(size = (1100, 820))
ax1 = Axis(fig[1, 1], ylabel = "ν̄ₑ / fission / MeV", yscale = log10, title = "Spectra over the range Newtrinos integrates (IBD threshold – 12 MeV)",
           yticks = LogTicks(-6:1))
ax2 = Axis(fig[2, 1], xlabel = "E_ν (MeV)", ylabel = "S(E) σ_IBD(E) (10⁻⁴³ cm² / fission / MeV)")
Ef = range(RF.IBD_THRESHOLD, 12.0, length = 500)
for iso in ISOS
    t = tab[iso]
    lines!(ax1, Ef, [RF.isotope_spectrum(iso, e) for e in Ef], color = COLOR[iso], linewidth = 2, label = LABEL[iso])
    scatter!(ax1, t.E, t.S, color = COLOR[iso], markersize = 6)
    lines!(ax2, Ef, [1e43 * RF.isotope_spectrum(iso, e) * RF.ibd_xsec(e) for e in Ef], color = COLOR[iso], linewidth = 2)
end
for ax in (ax1, ax2)
    vspan!(ax, [RF.IBD_THRESHOLD, 8.0], [2.0, 12.0], color = (:gray, 0.15))
end
xlims!(ax1, 1.7, 12); xlims!(ax2, 1.7, 12); ylims!(ax1, 1e-6, 5)
axislegend(ax1, position = :rt, framevisible = false)
text!(ax1, 9.9, 1.0, text = "shaded: outside the tables (2–8 MeV)", align = (:center, :center), fontsize = 12)

io = open("results/yields.csv", "w")
println(io, "isotope,newtrinos,refit_coefficients,table_based,frac_below_2MeV,frac_above_8MeV,dayabay2017,dayabay2017_err,mention2011,mention2011_err")
println("\nIBD yields per fission [1e-43 cm²] (Newtrinos IBD cross section):")
yN = Dict{Symbol, Float64}()
lines_txt = String[]
for iso in ISOS
    t = tab[iso]
    yN[iso] = 1e43 * RF.ibd_yield(one_iso(iso))
    tabS(e) = 2.0 <= e <= 8.0 ? exp(RF_interp(t.E, log.(t.S), e)) : RF.isotope_spectrum(iso, e)
    yT = 1e43 * yield(tabS)
    yR = 1e43 * yield(e -> poly(refit[iso], e))
    f_lo = 1e43 * yield(e -> RF.isotope_spectrum(iso, e); hi = 2.0) / yN[iso]
    f_hi = 1e43 * yield(e -> RF.isotope_spectrum(iso, e); lo = 8.0) / yN[iso]
    db, me = pubv(1, iso), pubv(2, iso)
    @printf("  %-5s Newtrinos %.3f   refit coefficients %.3f (%+.2f %%)   table-based %.3f (%+.2f %%)   below 2 MeV %.2f %%, above 8 MeV %.2f %%   Daya Bay HM %.2f (%+.1f %%)   Mention %.2f (%+.1f %%)\n",
            iso, yN[iso], yR, 100(yN[iso] / yR - 1), yT, 100(yN[iso] / yT - 1), 100f_lo, 100f_hi, db, 100(yN[iso] / db - 1), me, 100(yN[iso] / me - 1))
    @printf(io, "%s,%.4f,%.4f,%.4f,%.5f,%.5f,%.3f,%s,%.3f,%.3f\n", iso, yN[iso], yR, yT, f_lo, f_hi, db,
            isnan(puberr(1, iso)) ? "" : @sprintf("%.3f", puberr(1, iso)), me, puberr(2, iso))
    push!(lines_txt, @sprintf("%s: %.2f", LABEL[iso], yN[iso]))
end
close(io)
text!(ax2, 9.5, 0.2, text = "Newtrinos σₖ (10⁻⁴³ cm²/fission)\n" * join(lines_txt, "\n"), align = (:left, :bottom), fontsize = 12)
linkxaxes!(ax1, ax2)
save("ours/extrapolation.png", fig)

# ------------------------------------------------------------------------------------------------
# Fig. 3: IBD yields vs published Huber–Mueller values; Bugey-4 anchor
# ------------------------------------------------------------------------------------------------
fig = Figure(size = (1100, 460))
ax = Axis(fig[1, 1], ylabel = "Newtrinos / published σₖ", xticks = (1:4, [LABEL[i] for i in ISOS]),
          title = "IBD yield per fission: Newtrinos vs published Huber–Mueller values")
for (row, lab, col, dx) in ((1, "Daya Bay 2017 (HM model values)", :black, -0.1), (2, "Mention et al. 2011 (Mueller spectra, off-eq.)", :purple, 0.1))
    v = [pubv(row, i) for i in ISOS]; e = [puberr(row, i) for i in ISOS]
    r = [yN[i] for i in ISOS] ./ v
    ok = .!isnan.(e)
    errorbars!(ax, (1:4)[ok] .+ dx, r[ok], (r .* e ./ v)[ok], color = col, whiskerwidth = 6)
    scatter!(ax, (1:4) .+ dx, r, color = col, markersize = 11, label = lab)
end
hlines!(ax, [1.0], color = :gray, linestyle = :dash)
ylims!(ax, 0.9, 1.1)
axislegend(ax, position = :lt, framevisible = false, labelsize = 11)

# Bugey-4 anchor used by KamLAND (bugey4_scale): σ_f(Bugey-4) = 5.752 at 0.538 : 0.078 : 0.328 : 0.056 (Declais et al. 1994;
# also Mention et al. 2011, Sec. III A)
b4 = (U235 = 0.538, U238 = 0.078, Pu239 = 0.328, Pu241 = 0.056)
db = (U235 = 0.561, U238 = 0.076, Pu239 = 0.307, Pu241 = 0.056)       # Daya Bay, CPC 41, 013002 (2017), Table 10
kl1 = (U235 = 0.567, U238 = 0.078, Pu239 = 0.298, Pu241 = 0.057)      # KamLAND module, periods 1–2
kl2 = (U235 = 0.571, U238 = 0.078, Pu239 = 0.295, Pu241 = 0.056)      # KamLAND module, period 3 (2011–)
σb4 = 1e43 * RF.ibd_yield(b4); σdb = 1e43 * RF.ibd_yield(db)
println("\nBugey-4 anchor and reactor anomaly:")
@printf("  Newtrinos HM σ_f at Bugey-4 fuel = %.3f → Bugey-4 / HM = %.3f (Mention et al.: 0.943 with Mueller spectra incl. off-eq.)\n", σb4, 5.752 / σb4)
@printf("  Newtrinos HM σ_f at Daya Bay fuel = %.3f → Daya Bay 5.91 / HM = %.3f (Daya Bay: R(H+M) = 0.946 ± 0.020)\n", σdb, 5.91 / σdb)
@printf("  bugey4_scale: Bugey-4 fuel %.4f, KamLAND 1–2 %.4f, KamLAND 3 %.4f, Daya Bay fuel %.4f\n",
        RF.bugey4_scale(b4), RF.bugey4_scale(kl1), RF.bugey4_scale(kl2), RF.bugey4_scale(db))
ax = Axis(fig[1, 2], ylabel = "σ_f (10⁻⁴³ cm² / fission)", xticks = (1:2, ["Bugey-4 fuel", "Daya Bay fuel"]),
          title = "Measured σ_f vs Newtrinos Huber–Mueller")
scatter!(ax, [1, 2], [σb4, σdb], color = :royalblue, markersize = 13, label = "Newtrinos HM (ibd_yield)")
errorbars!(ax, [1, 2], [5.752, 5.91], [0.081, 0.12], color = :black, whiskerwidth = 8)
scatter!(ax, [1, 2], [5.752, 5.91], color = :black, marker = :rect, markersize = 11, label = "measured (Bugey-4, Daya Bay)")
scatter!(ax, [2], [5.91 / 0.946], color = :white, strokecolor = :black, strokewidth = 1.5, markersize = 12, label = "Daya Bay's HM prediction (5.91 / 0.946)")
for (x, σ, d) in ((1, σb4, 5.752), (2, σdb, 5.91))
    text!(ax, x + 0.08, (σ + d) / 2, text = @sprintf("ratio %.3f", d / σ), align = (:left, :center), fontsize = 12)
end
xlims!(ax, 0.5, 2.8); ylims!(ax, 5.5, 6.5)
axislegend(ax, position = :lt, framevisible = false, labelsize = 11)
save("ours/yields.png", fig)

open("results/anchor.csv", "w") do io
    println(io, "quantity,value")
    @printf(io, "sigma_f_HM_bugey4_fuel,%.4f\nbugey4_over_HM,%.4f\nsigma_f_HM_dayabay_fuel,%.4f\ndayabay_over_HM,%.4f\n", σb4, 5.752 / σb4, σdb, 5.91 / σdb)
    @printf(io, "bugey4_scale_kamland_1_2,%.4f\nbugey4_scale_kamland_3,%.4f\n", RF.bugey4_scale(kl1), RF.bugey4_scale(kl2))
end
Provenance
| Newtrinos.jl commit | c69601ed6d (reactor_flux) |
|---|---|
| Run date | 2026-10-13T10:32:12Z |
| Wall time | 1.4 min (8 threads) |
| Julia | 1.12.5 |
| Machine | AMD EPYC 7702P 64-Core Processor, 128 hardware threads, Linux |
| Environment | newtrinos_Manifest.toml · run.toml |
Downloads
CSV files hold one row per scan point: the scanned and profiled parameters
(sin2_theta23, dm2_32 in eV², dcp in rad, nuisance parameters), dchi2 = −2Δ log L
and the log-likelihood. JLD2 files contain the full NewtrinosResult objects.
| File | Size | SHA-256 |
|---|---|---|
| ours/extrapolation.png | 323.8 kB | 5c98dd91cb46… |
| ours/spectra.png | 359.1 kB | 4070c7d13715… |
| ours/yields.png | 144.4 kB | 6b268157ef9e… |
| results/anchor.csv | 183 B | 8f987e480f41… |
| results/coefficients.csv | 1.1 kB | c6328bc9575d… |
| results/spectra.csv | 6.8 kB | e3b4d0ffdbfc… |
| results/yields.csv | 398 B | 2d5a2ae3c206… |