
KamLAND · Phys. Rev. D 83, 052002 (2011)
Constraints on θ13 from A Three-Flavor Oscillation Analysis of Reactor Antineutrinos at KamLAND
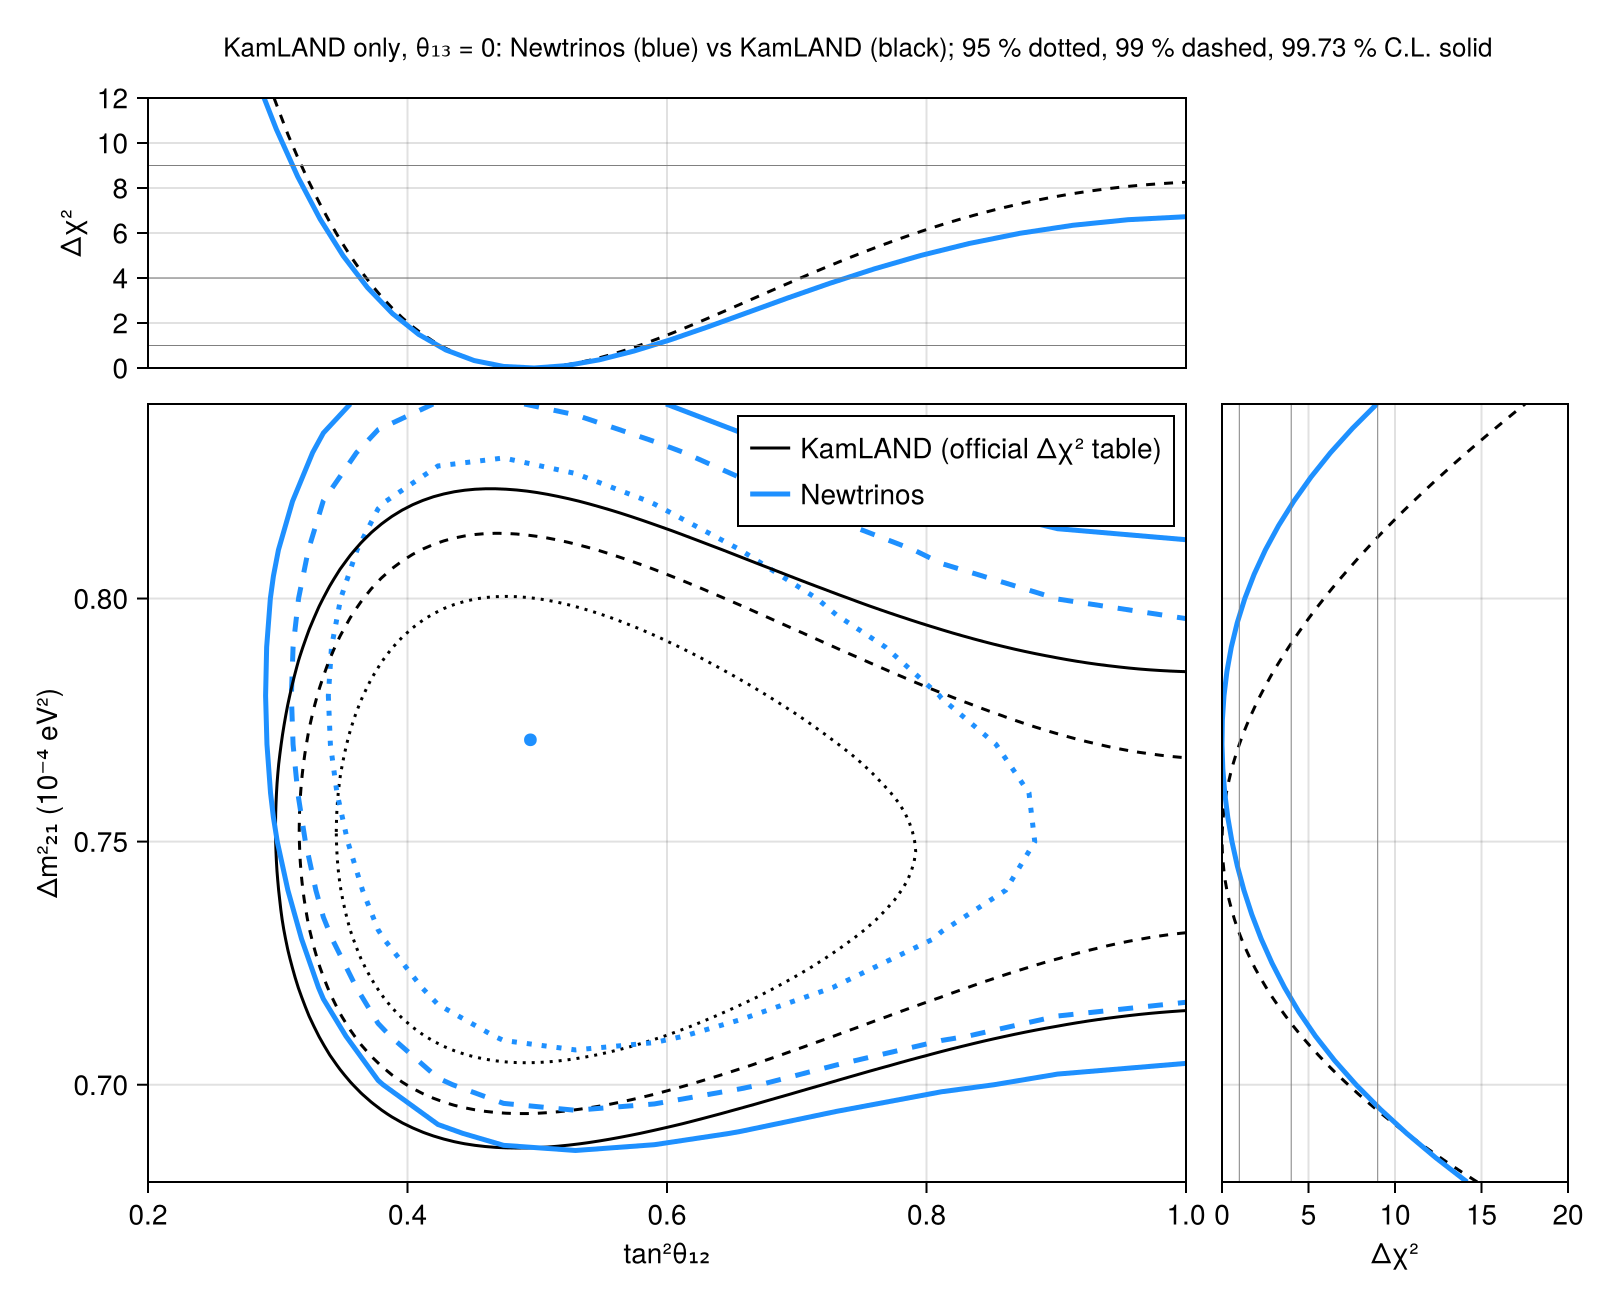
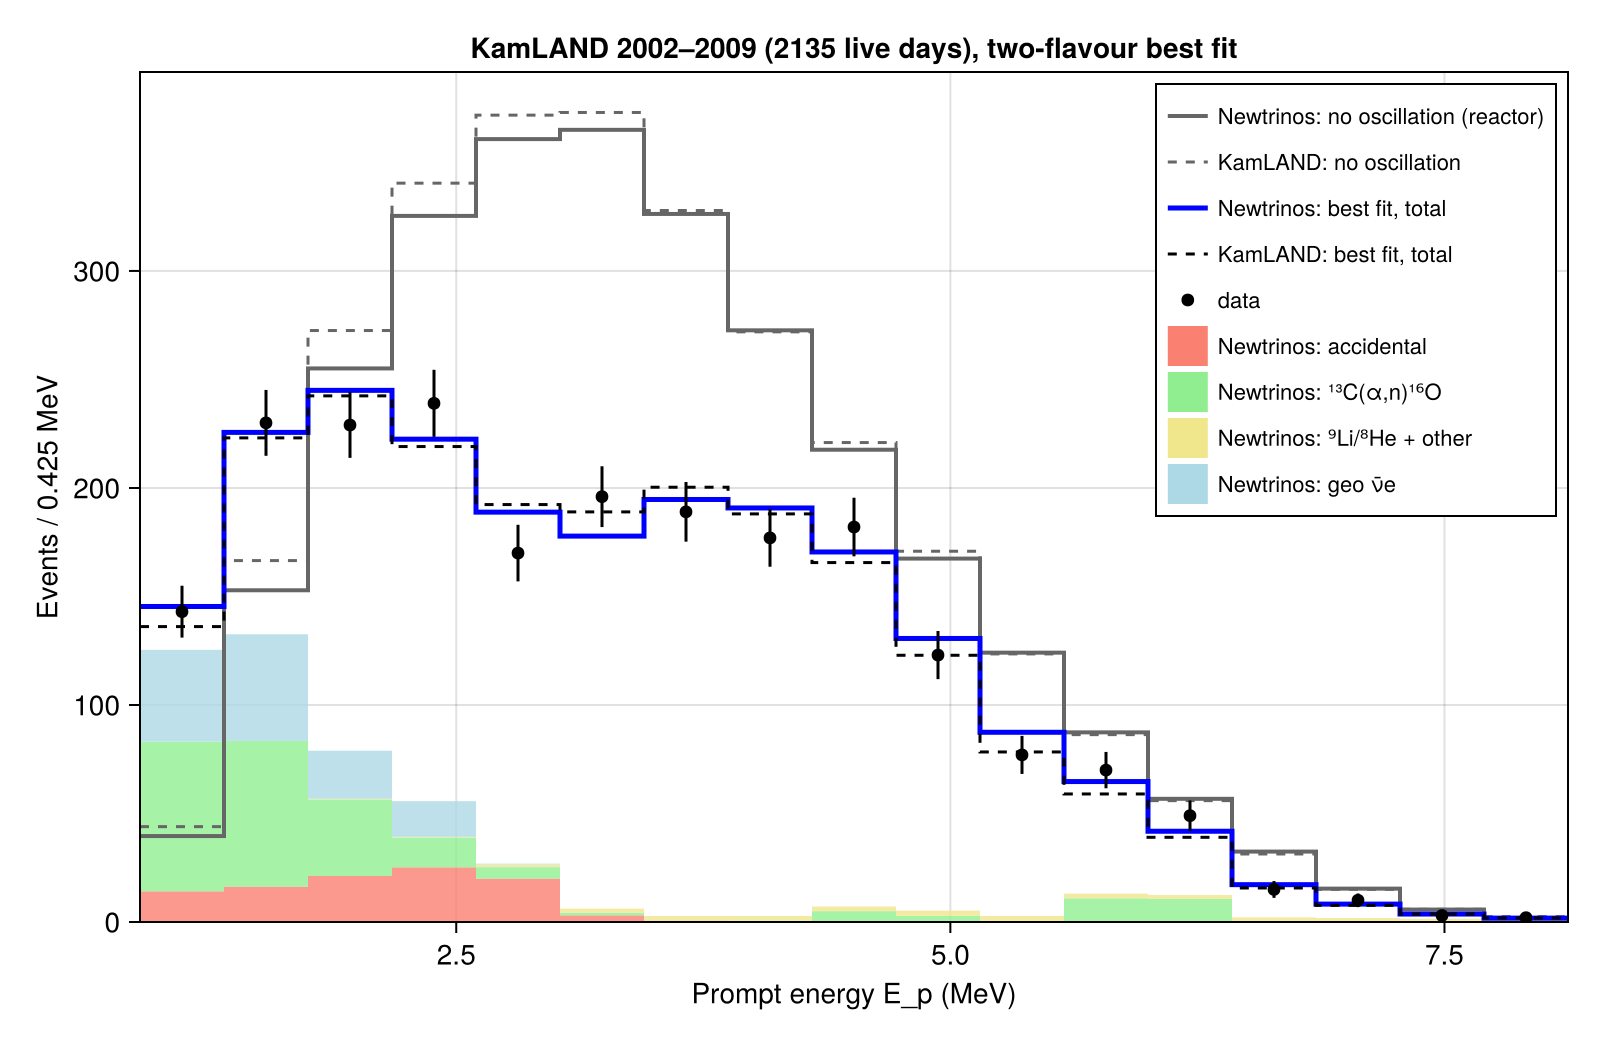
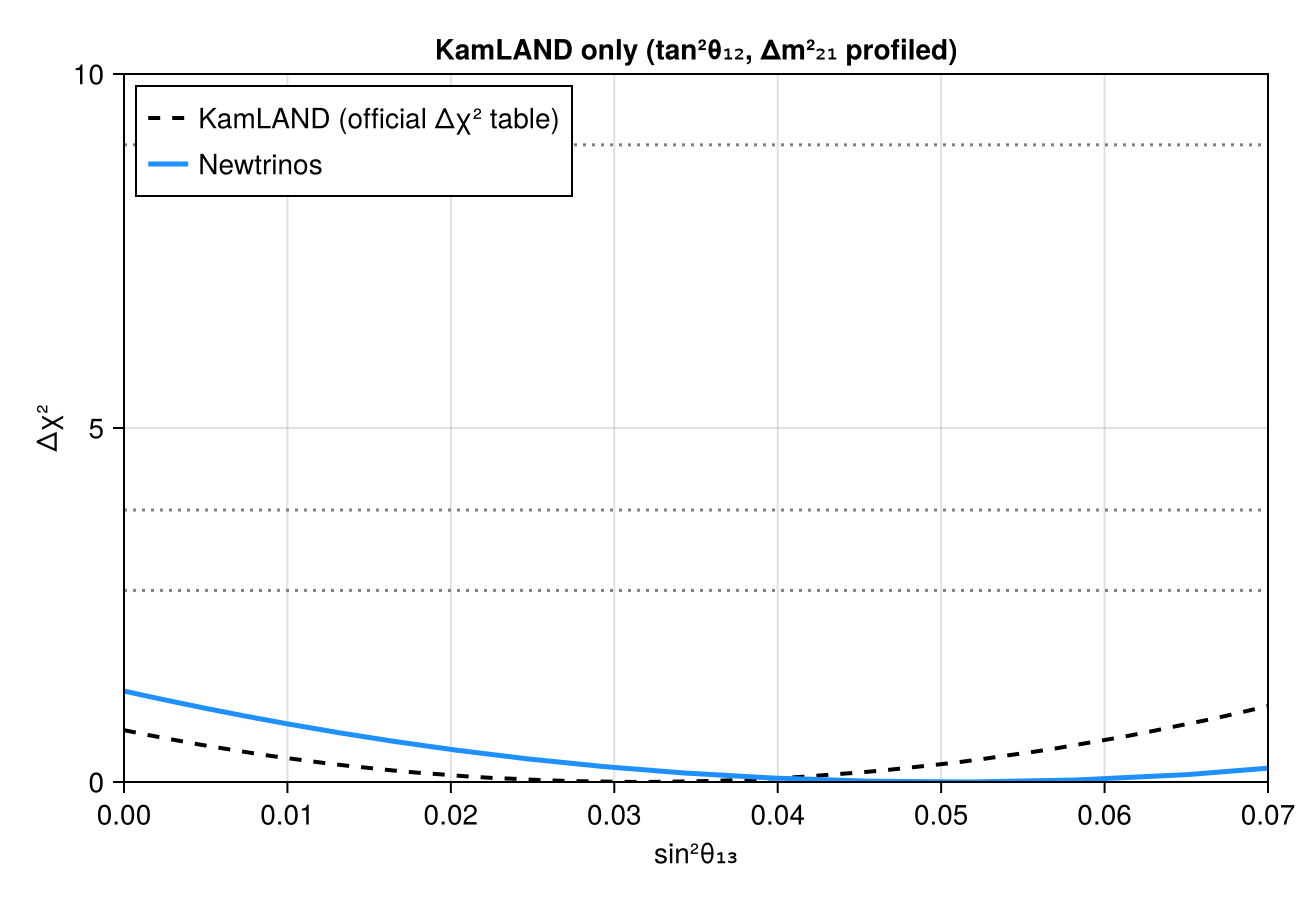
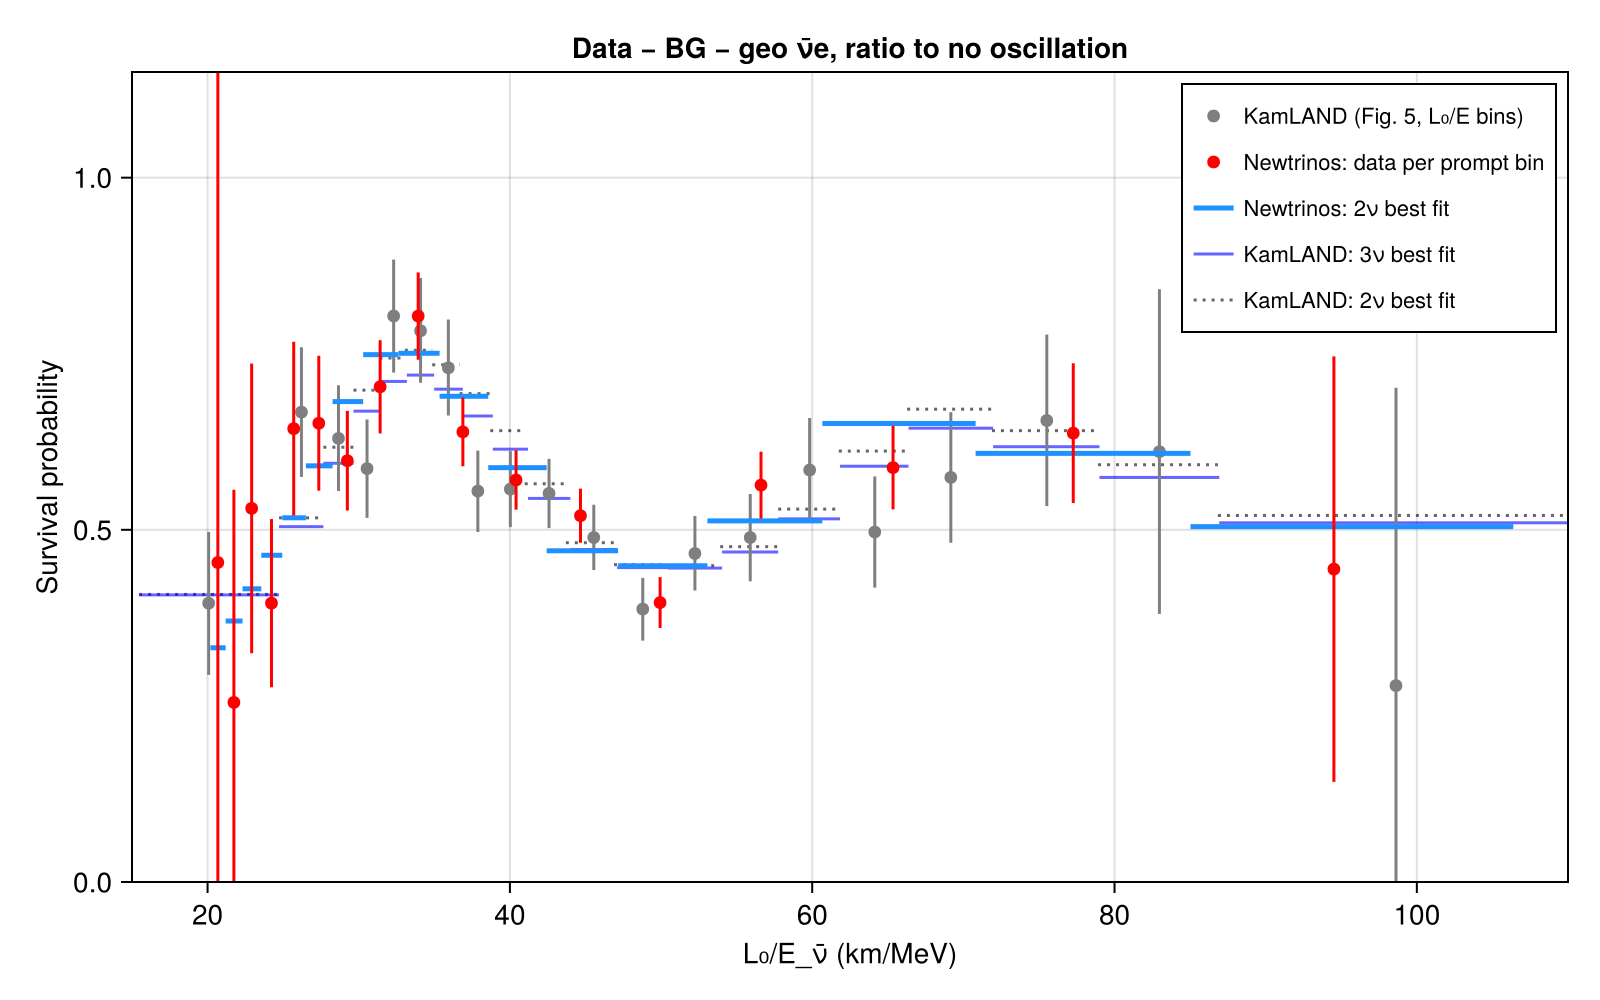
Reactor ν̄e disappearance at KamLAND in the (tan²θ₁₂, Δm²₂₁) plane with θ₁₃ = 0 (KamLAND only), with the Newtrinos kamland module on the 2002–2009 data of this paper (dataset = :kamland2011): the spectrum of the paper's Fig. 1 and a reactor prediction computed from first principles (IAEA PRIS power histories of all Japanese and Korean reactors, site baselines, Huber–Mueller spectra anchored to Bugey-4, 3ν with matter effects; 2869 no-oscillation events, KamLAND: 2879 ± 118). Compared with KamLAND's official Δχ² table of the data release. The same module, with the three data-taking periods of the 2013 data, is validated in the KamLAND PRD 88, 033001 entry. Also reproduced: the prompt spectrum with the best-fit components (Fig. 1), the KamLAND-only Δχ²(sin²θ₁₃) with θ₁₃ free (Fig. 4; Newtrinos sin²θ₁₃ = 0.052 +0.028 −0.046, official table 0.032 +0.037 −0.032), the ratio to no oscillation vs L₀/E (Fig. 5) and the survival probability vs the oscillation variable x of the paper (Fig. 6, Table III).
Figures
tan²θ₁₂ – Δm²₂₁, θ₁₃ = 0, 95%, 99%, 99.73% C.L., with Δχ² profiles: Newtrinos (blue) vs KamLAND's official Δχ² table (black) · Fig. 2(a)
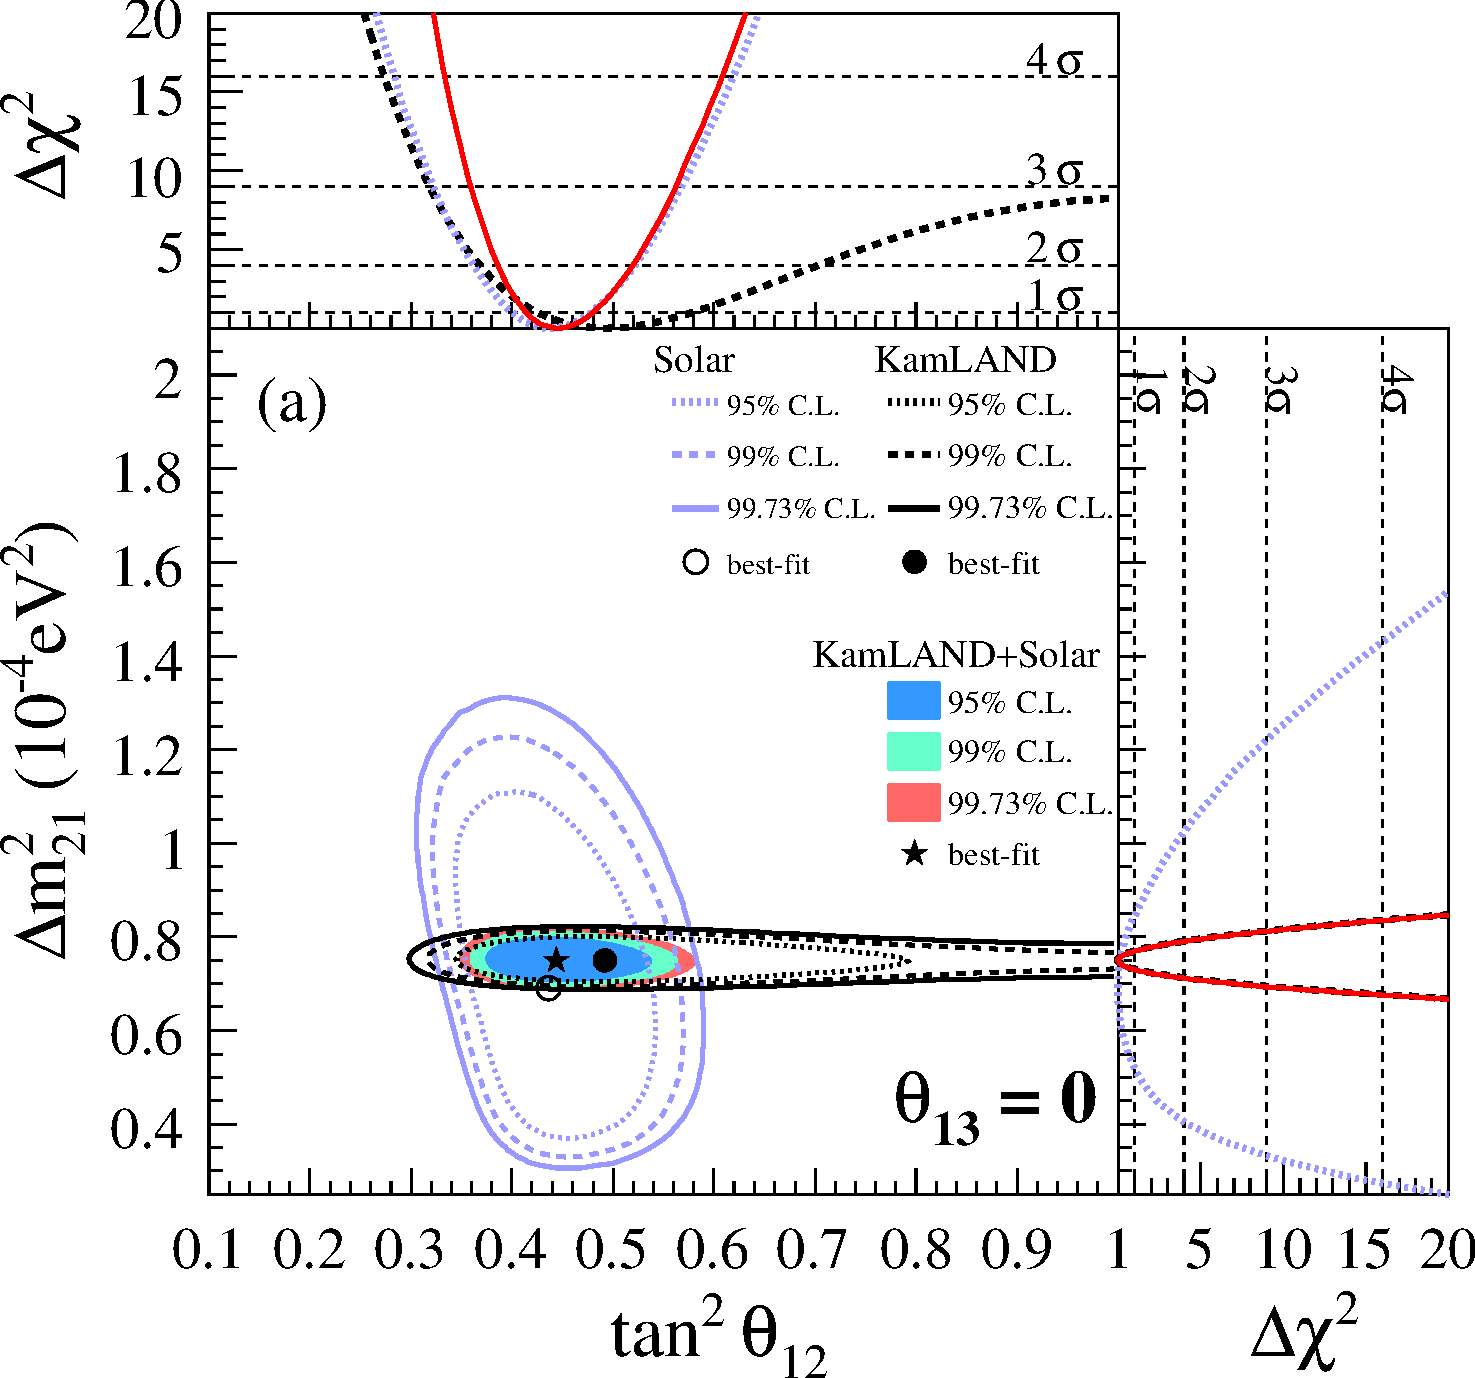
Original figure: KamLAND, Phys. Rev. D 83, 052002 (2011), Fig. 2(a), doi:10.1103/PhysRevD.83.052002. Not our work; shown for comparison, all rights with the authors and publisher.
Prompt energy spectrum with the best-fit background, geo-ν̄e and reactor contributions (two-flavour best fit) · Fig. 1
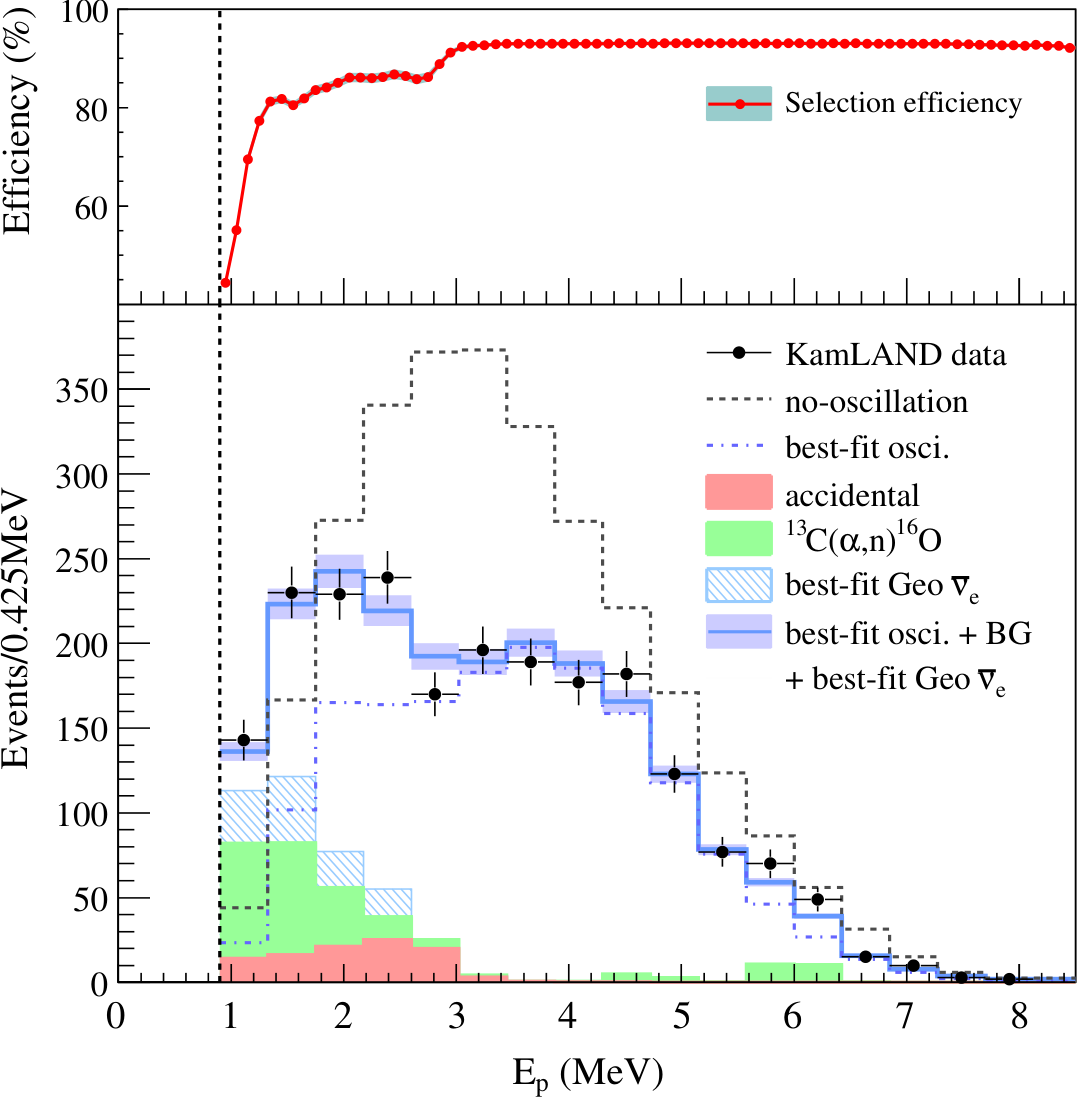
Original figure: KamLAND, Phys. Rev. D 83, 052002 (2011), Fig. 1, doi:10.1103/PhysRevD.83.052002. Not our work; shown for comparison, all rights with the authors and publisher.
Δχ²(sin²θ₁₃), KamLAND only: Newtrinos vs KamLAND's official Δχ² table · Fig. 4 (KamLAND curve)
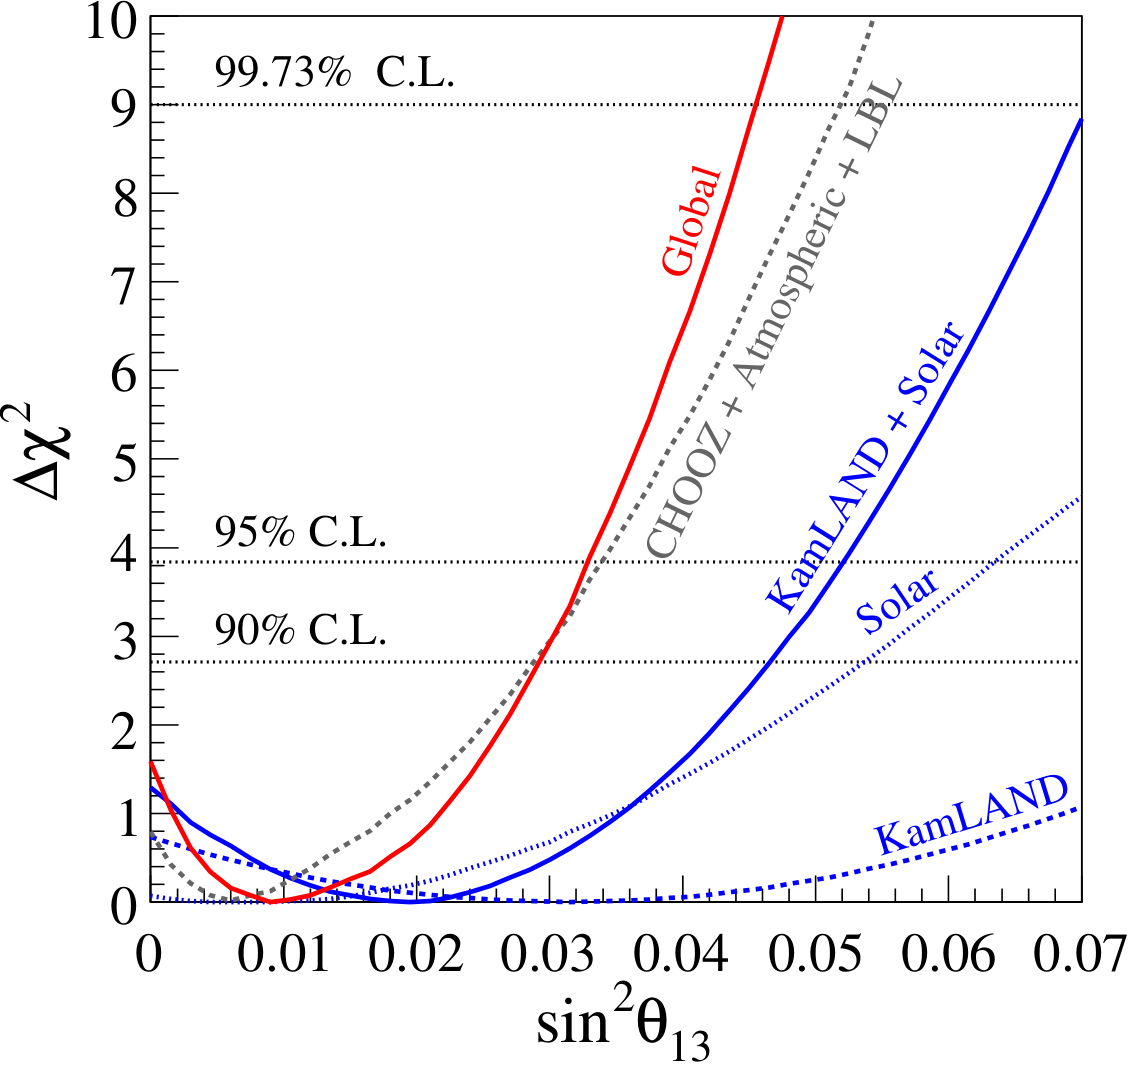
Original figure: KamLAND, Phys. Rev. D 83, 052002 (2011), Fig. 4 (KamLAND curve), doi:10.1103/PhysRevD.83.052002. Not our work; shown for comparison, all rights with the authors and publisher.
Ratio of the observed spectrum (minus backgrounds and geo ν̄e) to no oscillation vs L₀/E · Fig. 5
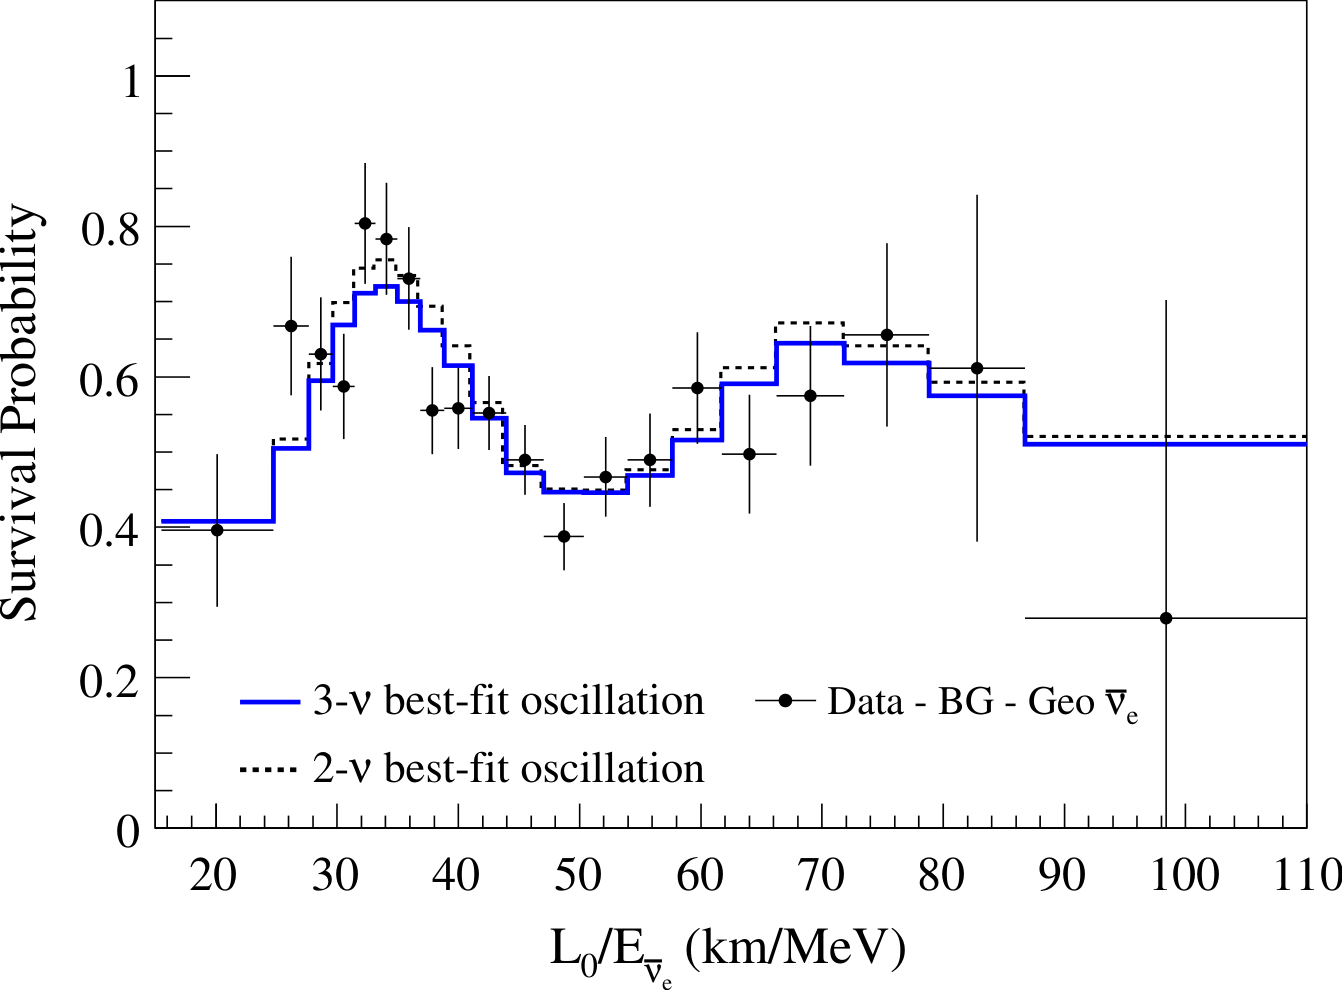
Original figure: KamLAND, Phys. Rev. D 83, 052002 (2011), Fig. 5, doi:10.1103/PhysRevD.83.052002. Not our work; shown for comparison, all rights with the authors and publisher.
Survival probability vs x = ⟨sin²2θ̂₁₂M sin²(1.27 Δm̂²₂₁M L/E)⟩ / sin²2θ̂₁₂ · Fig. 6, Table III
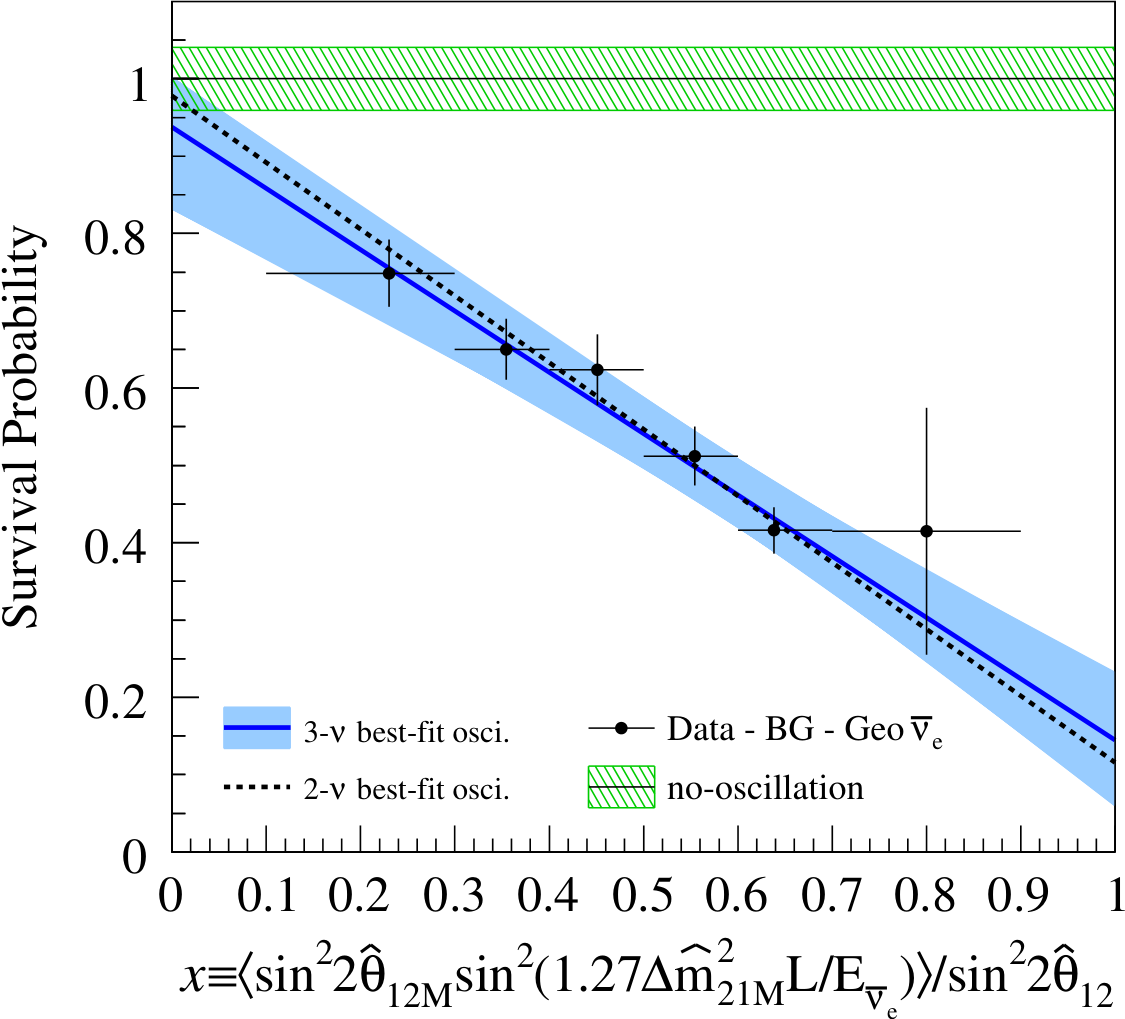
Original figure: KamLAND, Phys. Rev. D 83, 052002 (2011), Fig. 6, Table III, doi:10.1103/PhysRevD.83.052002. Not our work; shown for comparison, all rights with the authors and publisher.
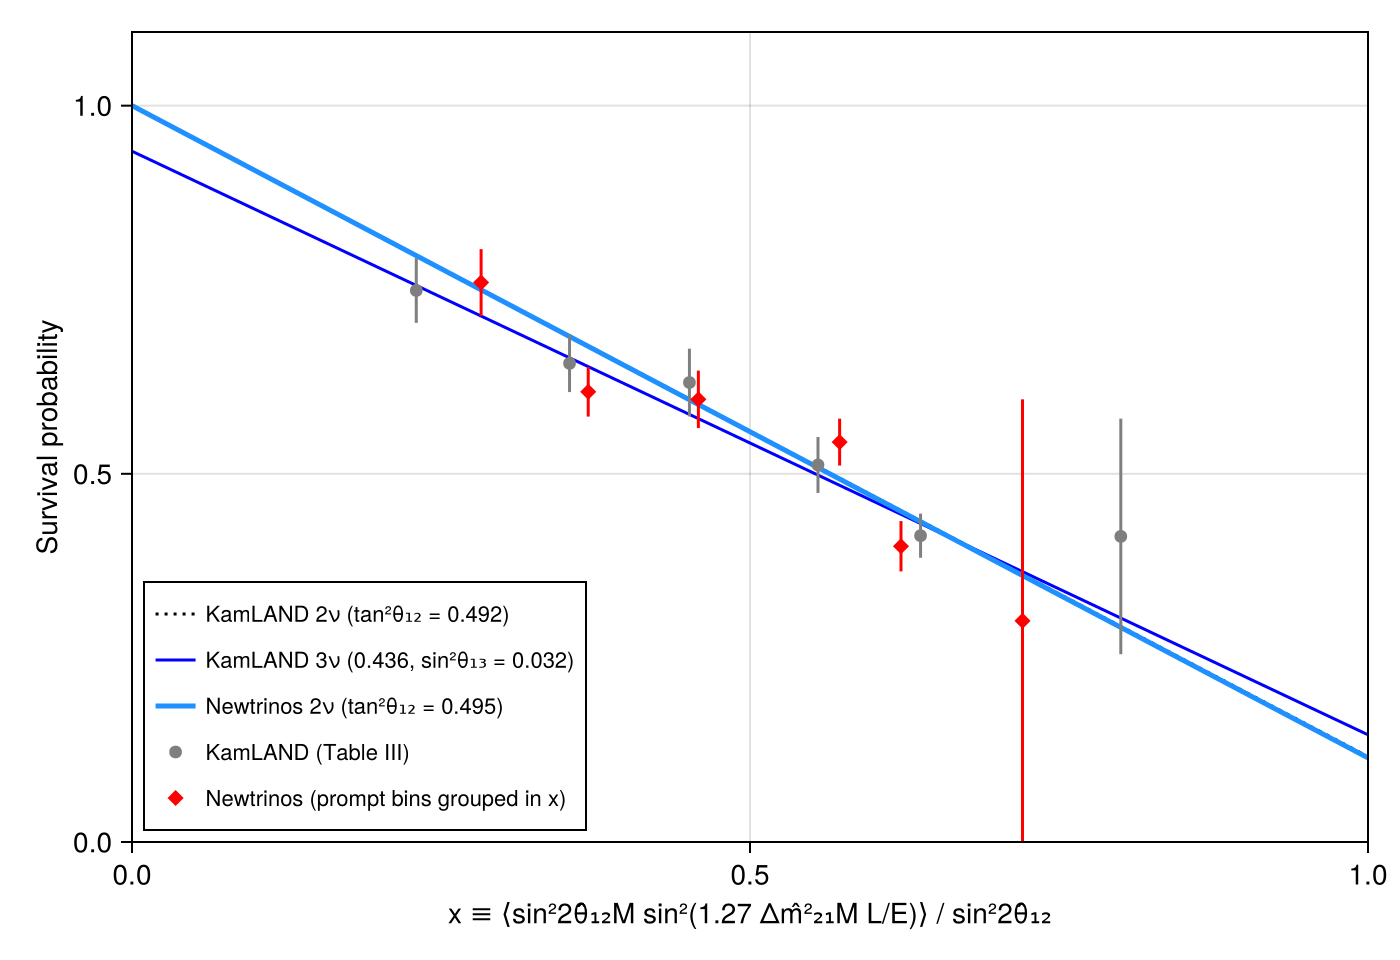
Known limitations
- The prompt-energy spectrum, best-fit background components and the selection efficiency are extracted from the vector graphics of the paper's Fig. 1 (17 bins of 0.425 MeV); KamLAND fits the unbinned, time-dependent data.
- Reactor operation is known from PRIS only as annual load factors per unit; KamLAND's live time is spread uniformly over 2002-03-09 – 2009-11-04.
- The official Δχ² table covers Δm²₂₁ = 6.8–8.4 ×10⁻⁵ eV² only; the figure is zoomed on this range (coarse validation grid).
- This paper publishes the 2002–2009 data only as one time-integrated spectrum, whereas KamLAND's fit is time-dependent (five periods, before and after the scintillator purification). Without the time information, ¹³C(α,n), geo-ν̄e and the low-energy reactor spectrum are more degenerate: the Newtrinos Δm²₂₁ range is wider and its best fit higher (+0.2 ×10⁻⁵ eV², 0.8σ) than KamLAND's. With the per-period 2013 data the same module reproduces KamLAND's Δm²₂₁ (KamLAND PRD 88, 033001 entry).
- The paper's Figs. 2 and 4 also show solar and combined results; only the KamLAND-only curves are reproduced.
- Figs. 5 and 6: the Newtrinos points are the 17 prompt-energy bins of the published spectrum (data minus the Newtrinos best-fit backgrounds and geo ν̄e, divided by the Newtrinos no-oscillation expectation; statistical errors), at L₀/E with E = E_p + 0.792 MeV, and for Fig. 6 grouped into the paper's x bins with x computed from the Newtrinos expectation at its two-flavour best fit (P = 1 − sin²2θ̂₁₂ x). KamLAND bins its unbinned events directly in L₀/E and x, so the points are not bin-by-bin comparable; KamLAND's points and histograms are extracted from the vector graphics (data/extract_fig5.py) and Table III.
Reproduce
git clone https://github.com/Newtrinos-org/Newtrinos.jl.git && cd Newtrinos.jl && git checkout c6612c255a- Download reproduce.jl and the
data/folder of this entry into an empty directory. julia -t 8 --project=/path/to/Newtrinos.jl reproduce.jl
# Reproduction of KamLAND, Phys. Rev. D 83, 052002 (2011) [arXiv:1009.4771], KamLAND-only two-flavour analysis (θ₁₃ = 0)
# with Newtrinos.jl: module `kamland` with `dataset = :kamland2011` (the 2002–2009 spectrum of the paper's Fig. 1, reactor
# prediction from the IAEA PRIS power histories with the common `reactor_flux` model). Compared with KamLAND's official
# Δχ² table (KamLAND data release, θ₁₃ = 0 slice).
# Run from this directory with the Newtrinos.jl environment at the pinned commit:
#   julia -t 32 --project=<path to Newtrinos.jl> reproduce.jl
using Newtrinos, Distributions, DataStructures, FileIO, CairoMakie, CSV, DataFrames, DelimitedFiles, Printf
using BAT: distprod

cd(@__DIR__); mkpath("ours"); mkpath("results"); mkpath("cache")

experiments = (kamland = Newtrinos.kamland.configure(; dataset = :kamland2011),)
likelihood = Newtrinos.generate_likelihood(experiments)
p = merge(Newtrinos.get_params(experiments), (θ₁₂ = atan(sqrt(0.49)), θ₁₃ = 0.0, Δm²₂₁ = 7.5e-5))
priors = merge(Newtrinos.get_priors(experiments), (Δm²₃₁ = p.Δm²₃₁, θ₁₃ = 0.0, θ₂₃ = p.θ₂₃, δCP = p.δCP,
               θ₁₂ = Uniform(atan(sqrt(0.2)), atan(sqrt(1.0))), Δm²₂₁ = Uniform(6.8e-5, 8.4e-5)))

bf = Newtrinos.find_mle(likelihood, distprod(; priors...), p)[3]
# coarse grids: this entry validates the module, it does not aim at smooth publication-quality contours
th12_dm21 = Newtrinos.profile(likelihood, priors, OrderedDict(:θ₁₂ => 15, :Δm²₂₁ => 17), p, cache_dir = "cache/th12_dm21")
dm21 = Newtrinos.profile(likelihood, priors, OrderedDict(:Δm²₂₁ => 33), p, cache_dir = "cache/dm21")
th12 = Newtrinos.profile(likelihood, priors, OrderedDict(:θ₁₂ => 33), p, cache_dir = "cache/th12")
FileIO.save("results/kamland2011.jld2", Dict("th12_dm21" => th12_dm21, "dm21" => dm21, "th12" => th12, "best_fit" => Dict(pairs(bf))))

Δχ²(r) = 2 .* (maximum(r.values.log_posterior) .- r.values.log_posterior)
"best fit and 1σ range from the Δχ² = 1 crossings (linear interpolation between grid points)"
function onesigma(x, y)
    y = y .- minimum(y); i = argmin(y)
    j = findlast(>(1), y[1:i]); lo = j === nothing ? x[1] : x[j] + (1 - y[j]) * (x[j+1] - x[j]) / (y[j+1] - y[j])
    j = findfirst(>(1), y[i:end]); hi = j === nothing ? x[end] : (j += i - 1; x[j-1] + (1 - y[j-1]) * (x[j] - x[j-1]) / (y[j] - y[j-1]))
    x[i], hi - x[i], x[i] - lo
end

# official KamLAND-only Δχ²(tan²θ₁₂, sin²θ₁₃, Δm²₂₁) of the data release, slice at θ₁₃ = 0
raw = readdlm(joinpath(pkgdir(Newtrinos), "src/experiments/kamland/kamland_7years/delta_chi2_4th_result.dat"))
sh = (121, 114, 81)
tan2 = reshape(raw[:, 1], sh)[1, :, 1]; dm2 = reshape(raw[:, 3], sh)[1, 1, :]; χ²off = reshape(raw[:, 4], sh)[1, :, :]
χ²off = χ²off .- minimum(χ²off)

dm = onesigma(dm21.axes.Δm²₂₁ .* 1e5, Δχ²(dm21)); t12 = onesigma(tan.(th12.axes.θ₁₂) .^ 2, Δχ²(th12))
dmo = onesigma(dm2 .* 1e5, vec(minimum(χ²off, dims = 1))); t12o = onesigma(tan2, vec(minimum(χ²off, dims = 2)))
CSV.write("results/dm21_profile.csv", DataFrame(dm2_21 = dm21.axes.Δm²₂₁, dchi2 = Δχ²(dm21)))
CSV.write("results/tan2_theta12_profile.csv", DataFrame(tan2_theta12 = tan.(th12.axes.θ₁₂) .^ 2, dchi2 = Δχ²(th12)))
open("results/summary.txt", "w") do io
    @printf io "KamLAND-only, θ13 = 0 (Newtrinos | official Δχ² table | paper)\n"
    @printf io "dm2_21 [1e-5 eV^2]   %.3f +%.3f -%.3f | %.3f +%.3f -%.3f | 7.50 +0.20 -0.20\n" dm... dmo...
    @printf io "tan2_theta12         %.3f +%.3f -%.3f | %.3f +%.3f -%.3f | 0.492 +0.086 -0.067\n" t12... t12o...
    @printf io "geo nu (x reference model 85 U / 21 Th): U %.2f, Th %.2f\n" bf.kamland_geo_u bf.kamland_geo_th
    for k in (:kamland_energy_scale, :kamland_flux_scale, :kamland_alpha_n, :kamland_li9)
        @printf io "pull %-22s %+.2f sigma\n" k bf[k]
    end
end
print(read("results/summary.txt", String))

# Fig. 2(a): 95 %, 99 %, 99.73 % C.L. (2 dof) and Δχ² profiles, Newtrinos (blue) vs official table (black)
fig = Figure(size = (800, 650))
ax = Axis(fig[2, 1], xlabel = "tan²θ₁₂", ylabel = "Δm²₂₁ (10⁻⁴ eV²)")
x = tan.(th12_dm21.axes.θ₁₂) .^ 2; y = th12_dm21.axes.Δm²₂₁ .* 1e4
for (lv, ls) in zip((0.95, 0.99, 0.9973), (:dot, :dash, :solid))
    contour!(ax, tan2, dm2 .* 1e4, χ²off, levels = [quantile(Chisq(2), lv)], color = :black, linestyle = ls, linewidth = 1.5)
    contour!(ax, x, y, Δχ²(th12_dm21), levels = [quantile(Chisq(2), lv)], color = :dodgerblue, linestyle = ls, linewidth = 2.5)
end
lines!(ax, [NaN], [NaN], color = :black, label = "KamLAND (official Δχ² table)")
lines!(ax, [NaN], [NaN], color = :dodgerblue, linewidth = 2.5, label = "Newtrinos")
scatter!(ax, [tan(bf.θ₁₂)^2], [bf.Δm²₂₁ * 1e4], color = :dodgerblue)
axislegend(ax, position = :rt)
xlims!(ax, 0.2, 1.0); ylims!(ax, 0.68, 0.84)
axt = Axis(fig[1, 1], ylabel = "Δχ²")
lines!(axt, tan2, vec(minimum(χ²off, dims = 2)), color = :black, linestyle = :dash, linewidth = 1.5)
lines!(axt, tan.(th12.axes.θ₁₂) .^ 2, Δχ²(th12), color = :dodgerblue, linewidth = 2.5)
hlines!(axt, [1, 4, 9], color = :gray, linewidth = 0.5); xlims!(axt, 0.2, 1.0); ylims!(axt, 0, 12); hidexdecorations!(axt, grid = false)
axr = Axis(fig[2, 2], xlabel = "Δχ²")
lines!(axr, vec(minimum(χ²off, dims = 1)), dm2 .* 1e4, color = :black, linestyle = :dash, linewidth = 1.5)
lines!(axr, Δχ²(dm21), dm21.axes.Δm²₂₁ .* 1e4, color = :dodgerblue, linewidth = 2.5)
vlines!(axr, [1, 4, 9], color = :gray, linewidth = 0.5); ylims!(axr, 0.68, 0.84); xlims!(axr, 0, 20); hideydecorations!(axr, grid = false)
colsize!(fig.layout, 2, Relative(0.25)); rowsize!(fig.layout, 1, Relative(0.25))
Label(fig[0, :], "KamLAND only, θ₁₃ = 0: Newtrinos (blue) vs KamLAND (black); 95 % dotted, 99 % dashed, 99.73 % C.L. solid", fontsize = 13)
save("ours/fig2a_tan2th12_dm21.png", fig)

# ---------------- Fig. 4: Δχ²(sin²θ₁₃), KamLAND only (tan²θ₁₂ and Δm²₂₁ profiled) ----------------
priors3 = merge(priors, (θ₁₃ = Uniform(0.0, asin(sqrt(0.08))),))
th13 = Newtrinos.profile(likelihood, priors3, OrderedDict(:θ₁₃ => 21), merge(p, (θ₁₃ = asin(sqrt(0.02)),)), cache_dir = "cache/th13")
s13 = sin.(th13.axes.θ₁₃) .^ 2; χ²13 = Δχ²(th13)
s13off = reshape(raw[:, 2], sh)[:, 1, 1]; χ²13off = vec(minimum(reshape(raw[:, 4], sh), dims = (2, 3))); χ²13off .-= minimum(χ²13off)
CSV.write("results/sin2_theta13_profile.csv", DataFrame(sin2_theta13 = s13, dchi2 = χ²13))
st = onesigma(s13, χ²13); sto = onesigma(s13off, χ²13off)
open("results/summary.txt", "a") do io
    @printf io "KamLAND-only, θ13 free: sin2_theta13 %.3f +%.3f -%.3f | official table %.3f +%.3f -%.3f | paper 0.032 +0.037 -0.037\n" st... sto...
end
fig = Figure(size = (650, 450))
ax = Axis(fig[1, 1], xlabel = "sin²θ₁₃", ylabel = "Δχ²", title = "KamLAND only (tan²θ₁₂, Δm²₂₁ profiled)")
lines!(ax, s13off, χ²13off, color = :black, linestyle = :dash, linewidth = 2, label = "KamLAND (official Δχ² table)")
lines!(ax, s13, χ²13, color = :dodgerblue, linewidth = 2.5, label = "Newtrinos")
hlines!(ax, [quantile(Chisq(1), c) for c in (0.9, 0.95, 0.9973)], color = :gray, linestyle = :dot)
xlims!(ax, 0, 0.07); ylims!(ax, 0, 10); axislegend(ax, position = :lt)
save("ours/fig4_sin2th13_profile.png", fig)

# ---------------- Figs. 1, 5, 6: spectrum and survival probability at the two-flavour best fit ----------------
const K = Newtrinos.kamland
a = experiments.kamland.assets; phys = experiments.kamland.physics; pd = a.periods[1]
ε = K.ESCALE_UNC * bf.kamland_energy_scale; rfac = K.rate_factor(bf, a.ds, 1)
μ = K.get_expected(bf, phys, a)[1]
reac = K.reactor_events(bf, phys, a; ε)[1] .* rfac
reac0 = K.reactor_events(merge(bf, (θ₁₂ = 0.0, θ₁₃ = 0.0)), phys, a; ε)[1] .* rfac      # no oscillation
acc = pd.acc; an = pd.alpha_n .* (1 + a.ds.alpha_n_unc * bf.kamland_alpha_n); li9 = pd.li9 .* (1 + a.ds.li9_unc * bf.kamland_li9)
geo = pd.geo_u .* bf.kamland_geo_u .+ pd.geo_th .* bf.kamland_geo_th
bg = acc .+ an .+ li9 .+ geo
N = pd.observed
kdir = joinpath(pkgdir(Newtrinos), "src/experiments/kamland/kamland_periods/data")
kl = CSV.read(joinpath(kdir, "kamland2011.csv"), DataFrame)[1:17, :]
noosc_kl = CSV.read(joinpath(kdir, "noosc_2011.csv"), DataFrame; comment = "#")
edges = K.EDGES; Ec = 0.5 .* (edges[1:end-1] .+ edges[2:end]); days = pd.days

# Fig. 1: prompt spectrum (events / 0.425 MeV)
fig = Figure(size = (800, 520))
ax = Axis(fig[1, 1], xlabel = "Prompt energy E_p (MeV)", ylabel = "Events / 0.425 MeV",
          title = "KamLAND 2002–2009 (2135 live days), two-flavour best fit")
stp(y) = vcat(y, y[end])
xs2 = repeat(edges, inner = 2)[2:end-1]; y2(y) = repeat(y, inner = 2)     # step-shaped bands
band!(ax, xs2, zeros(34), y2(acc), color = (:salmon, 0.8))
band!(ax, xs2, y2(acc), y2(acc .+ an), color = (:lightgreen, 0.8))
band!(ax, xs2, y2(acc .+ an), y2(acc .+ an .+ li9), color = (:khaki, 0.8))
band!(ax, xs2, y2(acc .+ an .+ li9), y2(bg), color = (:lightblue, 0.8))
stairs!(ax, edges, stp(reac0), step = :post, color = :gray40, linewidth = 2, label = "Newtrinos: no oscillation (reactor)")
stairs!(ax, edges, stp(noosc_kl.events[1:17]), step = :post, color = :gray40, linestyle = :dash, label = "KamLAND: no oscillation")
stairs!(ax, edges, stp(μ), step = :post, color = :blue, linewidth = 2.5, label = "Newtrinos: best fit, total")
stairs!(ax, edges, stp(kl.total .* days), step = :post, color = :black, linestyle = :dash, linewidth = 1.5, label = "KamLAND: best fit, total")
errorbars!(ax, Ec, N, sqrt.(max.(N, 1)), color = :black); scatter!(ax, Ec, N, color = :black, label = "data")
for (c, l) in ((:salmon, "accidental"), (:lightgreen, "¹³C(α,n)¹⁶O"), (:khaki, "⁹Li/⁸He + other"), (:lightblue, "geo ν̄e"))
    poly!(ax, Point2f[(NaN, NaN)], color = c, label = "Newtrinos: " * l)
end
xlims!(ax, 0.9, 8.125); ylims!(ax, 0, nothing); axislegend(ax, position = :rt, labelsize = 11)
save("ours/fig1_prompt_spectrum.png", fig)

# Fig. 5: (data − background − geo) / no-oscillation expectation vs L₀/E, L₀ = 180 km, per prompt-energy bin
LE = 180 ./ (Ec .+ K.ΔE_NU)
ratio = (N .- bg) ./ reac0; ratio_err = sqrt.(max.(N, 1)) ./ reac0
k5 = CSV.read("data/fig5_points.csv", DataFrame; comment = "#")
h5 = CSV.read("data/fig5_histograms.csv", DataFrame; comment = "#")
CSV.write("results/fig5_survival_LE.csv", DataFrame(E_lo = edges[1:end-1], E_hi = edges[2:end], LE_km_per_MeV = LE,
                                                    ratio = ratio, ratio_err = ratio_err, expected = reac ./ reac0))
fig = Figure(size = (800, 500))
ax = Axis(fig[1, 1], xlabel = "L₀/E_ν̄ (km/MeV)", ylabel = "Survival probability", title = "Data − BG − geo ν̄e, ratio to no oscillation")
for (m, c, s) in (("2nu", :black, :dot), ("3nu", :blue, :solid))
    h = h5[h5.model .== m, :]
    for r in eachrow(h); lines!(ax, [r.LE_lo, r.LE_hi], [r.P, r.P], color = (c, 0.6), linestyle = s, linewidth = 1.5); end
end
rangebars!(ax, k5.LE, k5.P_lo, k5.P_hi, color = :gray50); scatter!(ax, k5.LE, k5.P, color = :gray50, label = "KamLAND (Fig. 5, L₀/E bins)")
LEe = 180 ./ (edges .+ K.ΔE_NU)
for b in 1:17; lines!(ax, [LEe[b+1], LEe[b]], fill((reac ./ reac0)[b], 2), color = :dodgerblue, linewidth = 2.5); end
errorbars!(ax, LE, ratio, ratio_err, color = :red); scatter!(ax, LE, ratio, color = :red, label = "Newtrinos: data per prompt bin")
lines!(ax, [NaN], [NaN], color = :dodgerblue, linewidth = 2.5, label = "Newtrinos: 2ν best fit")
lines!(ax, [NaN], [NaN], color = (:blue, 0.6), label = "KamLAND: 3ν best fit"); lines!(ax, [NaN], [NaN], color = (:black, 0.6), linestyle = :dot, label = "KamLAND: 2ν best fit")
xlims!(ax, 15, 110); ylims!(ax, 0, 1.15); axislegend(ax, position = :rt, labelsize = 11)
save("ours/fig5_survival_LE.png", fig)

# Fig. 6: survival probability vs x = ⟨sin²2θ̂₁₂M sin²(1.27 Δm̂²₂₁M L/E)⟩ / sin²2θ̂₁₂ at the two-flavour best fit, where
# P = 1 − sin²2θ̂₁₂ x exactly; x per prompt bin from the Newtrinos expectation
s2 = sin(2 * bf.θ₁₂)^2
x = (1 .- reac ./ reac0) ./ s2
t6 = (x_lo = [0.1, 0.3, 0.4, 0.5, 0.6, 0.7], x_hi = [0.3, 0.4, 0.5, 0.6, 0.7, 0.9], x = [0.230, 0.354, 0.451, 0.555, 0.638, 0.800],
      p = [0.749, 0.650, 0.624, 0.512, 0.416, 0.415], σ = [0.044, 0.039, 0.046, 0.038, 0.030, 0.160])   # Table III
# the same binning in x for the Newtrinos points (events summed per x bin)
px = map(1:6) do i
    sel = t6.x_lo[i] .<= x .< t6.x_hi[i]
    any(sel) || return (NaN, NaN, NaN)
    (sum((x .* reac0)[sel]) / sum(reac0[sel]), sum((N .- bg)[sel]) / sum(reac0[sel]), sqrt(sum(N[sel])) / sum(reac0[sel]))
end
CSV.write("results/fig6_survival_x.csv", DataFrame(x_lo = t6.x_lo, x_hi = t6.x_hi, x_mean = first.(px), p = getindex.(px, 2),
                                                   sigma_p = last.(px), x_kamland = t6.x, p_kamland = t6.p, sigma_kamland = t6.σ))
fig = Figure(size = (700, 480))
ax = Axis(fig[1, 1], xlabel = "x ≡ ⟨sin²2θ̂₁₂M sin²(1.27 Δm̂²₂₁M L/E)⟩ / sin²2θ̂₁₂", ylabel = "Survival probability")
xs = [0.0, 1.0]
t2(t) = 4t / (1 + t)^2
lines!(ax, xs, 1 .- t2(0.492) .* xs, color = :black, linestyle = :dot, label = "KamLAND 2ν (tan²θ₁₂ = 0.492)")
lines!(ax, xs, (1 - 0.032)^2 + 0.032^2 .- (1 - 0.032)^2 * t2(0.436) .* xs, color = :blue, label = "KamLAND 3ν (0.436, sin²θ₁₃ = 0.032)")
lines!(ax, xs, 1 .- s2 .* xs, color = :dodgerblue, linewidth = 2.5, label = @sprintf("Newtrinos 2ν (tan²θ₁₂ = %.3f)", tan(bf.θ₁₂)^2))
errorbars!(ax, t6.x, t6.p, t6.σ, color = :gray50); scatter!(ax, t6.x, t6.p, color = :gray50, label = "KamLAND (Table III)")
errorbars!(ax, first.(px), getindex.(px, 2), last.(px), color = :red)
scatter!(ax, first.(px), getindex.(px, 2), color = :red, marker = :diamond, label = "Newtrinos (prompt bins grouped in x)")
xlims!(ax, 0, 1); ylims!(ax, 0, 1.1); axislegend(ax, position = :lb, labelsize = 11)
save("ours/fig6_survival_x.png", fig)
print(read("results/summary.txt", String))
Provenance
| Newtrinos.jl commit | c6612c255a (kamland, reactor_flux, osc) |
|---|---|
| Run date | 2026-10-21T16:04:59Z |
| Wall time | 4.6 min (128 threads) |
| Julia | 1.12.5 |
| Machine | AMD EPYC 7702P 64-Core Processor, 128 hardware threads, Linux |
| Environment | newtrinos_Manifest.toml · run.toml |
Downloads
CSV files hold one row per scan point: the scanned and profiled parameters
(sin2_theta23, dm2_32 in eV², dcp in rad, nuisance parameters), dchi2 = −2Δ log L
and the log-likelihood. JLD2 files contain the full NewtrinosResult objects.
| File | Size | SHA-256 |
|---|---|---|
| ours/fig1_prompt_spectrum.png | 122.7 kB | 636a63df3cac… |
| ours/fig2a_tan2th12_dm21.png | 242.5 kB | cbf8d783ae0d… |
| ours/fig4_sin2th13_profile.png | 74.7 kB | 3b4e94130d6c… |
| ours/fig5_survival_LE.png | 98.5 kB | e97dbeee4ce8… |
| ours/fig6_survival_x.png | 118.1 kB | c2ef48f357b3… |
| results/dm21_profile.csv | 926 B | 8f370529d569… |
| results/fig5_survival_LE.csv | 1.5 kB | 803010c35080… |
| results/fig6_survival_x.csv | 561 B | e384f875d40f… |
| results/kamland2011.jld2 | 82.8 kB | 7ddd655380d8… |
| results/sin2_theta13_profile.csv | 820 B | 9c117963f70a… |
| results/summary.txt | 574 B | 6596514b6bb3… |
| results/tan2_theta12_profile.csv | 1.2 kB | 6ccaf8a0b067… |