
M. Honda, M. Sajjad Athar, T. Kajita, K. Kasahara, S. Midorikawa · Phys. Rev. D 92, 023004 (2015)
Atmospheric neutrino flux calculation using the NRLMSISE-00 atmospheric model
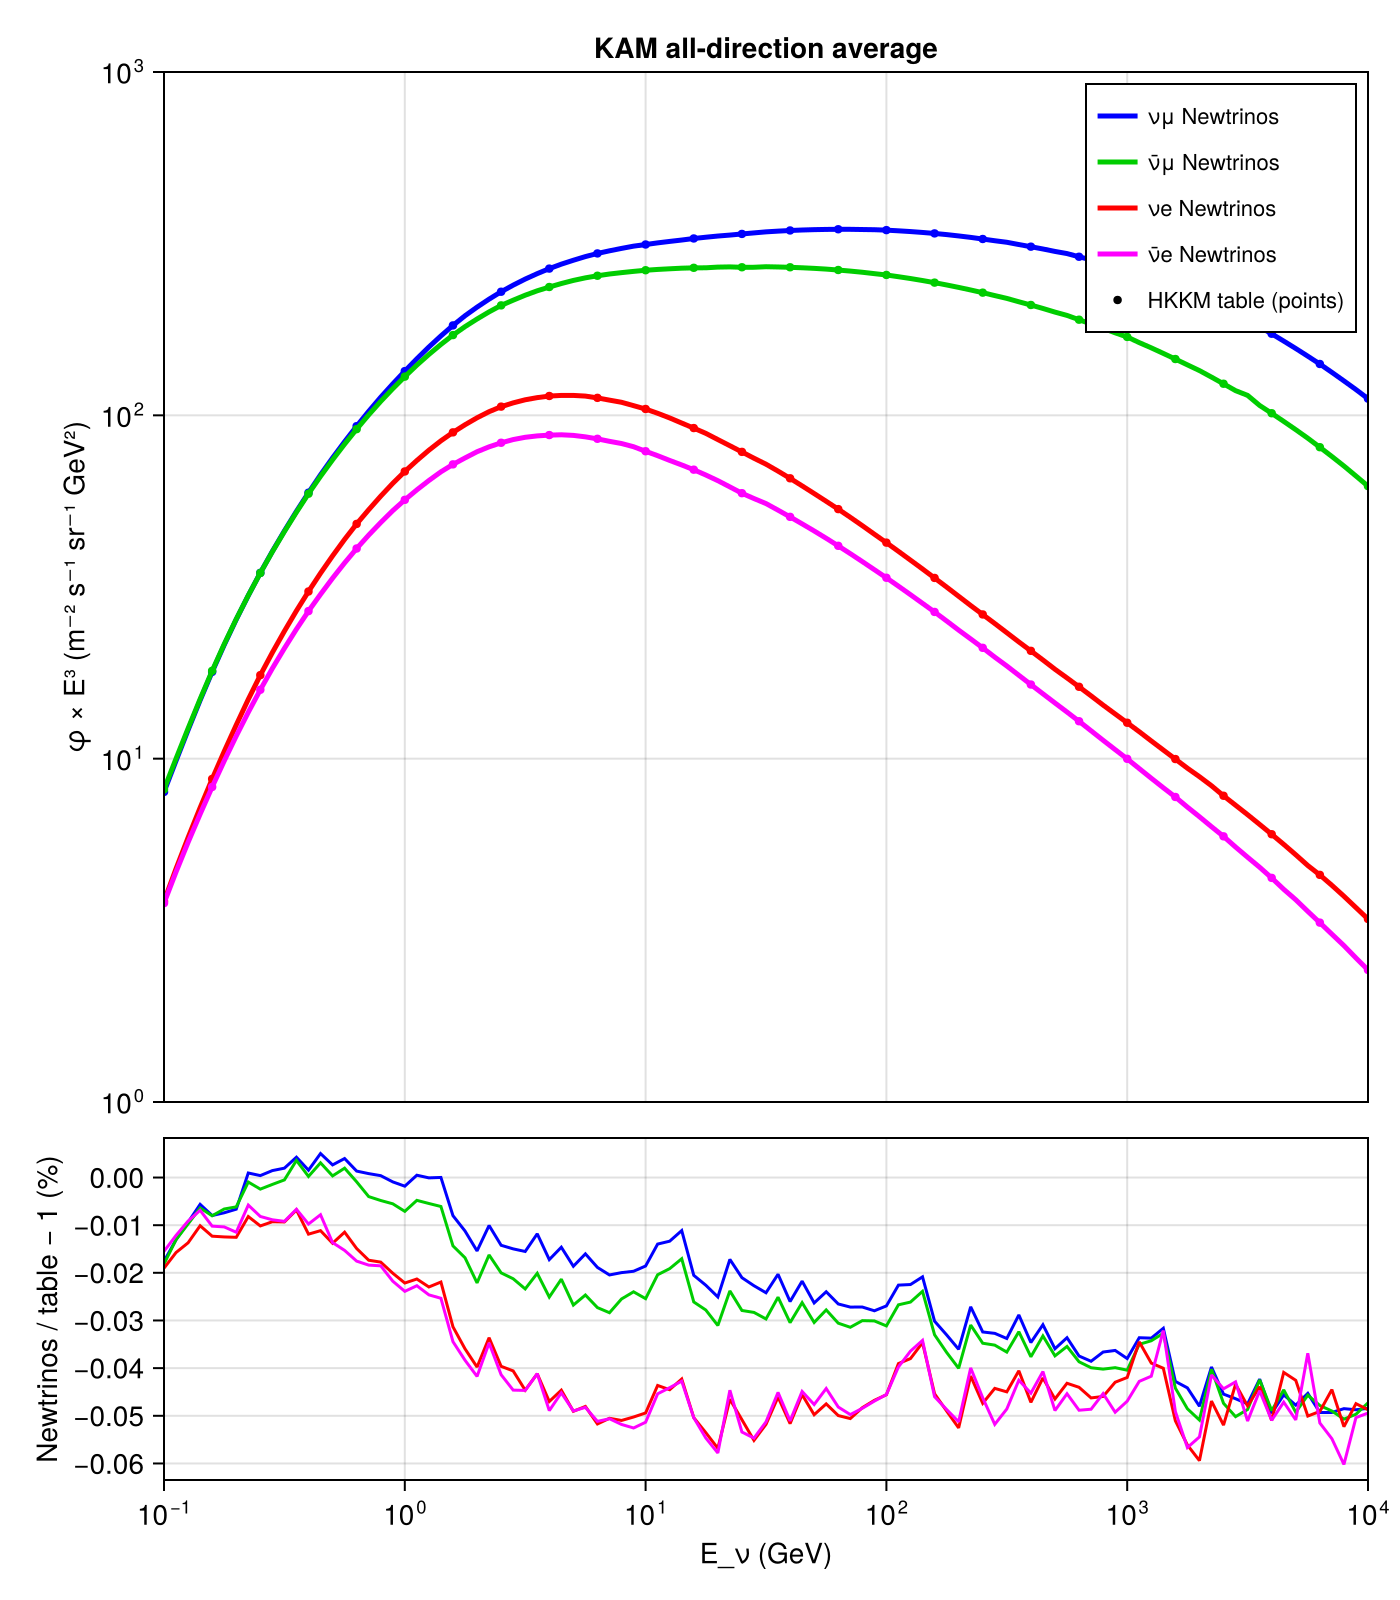
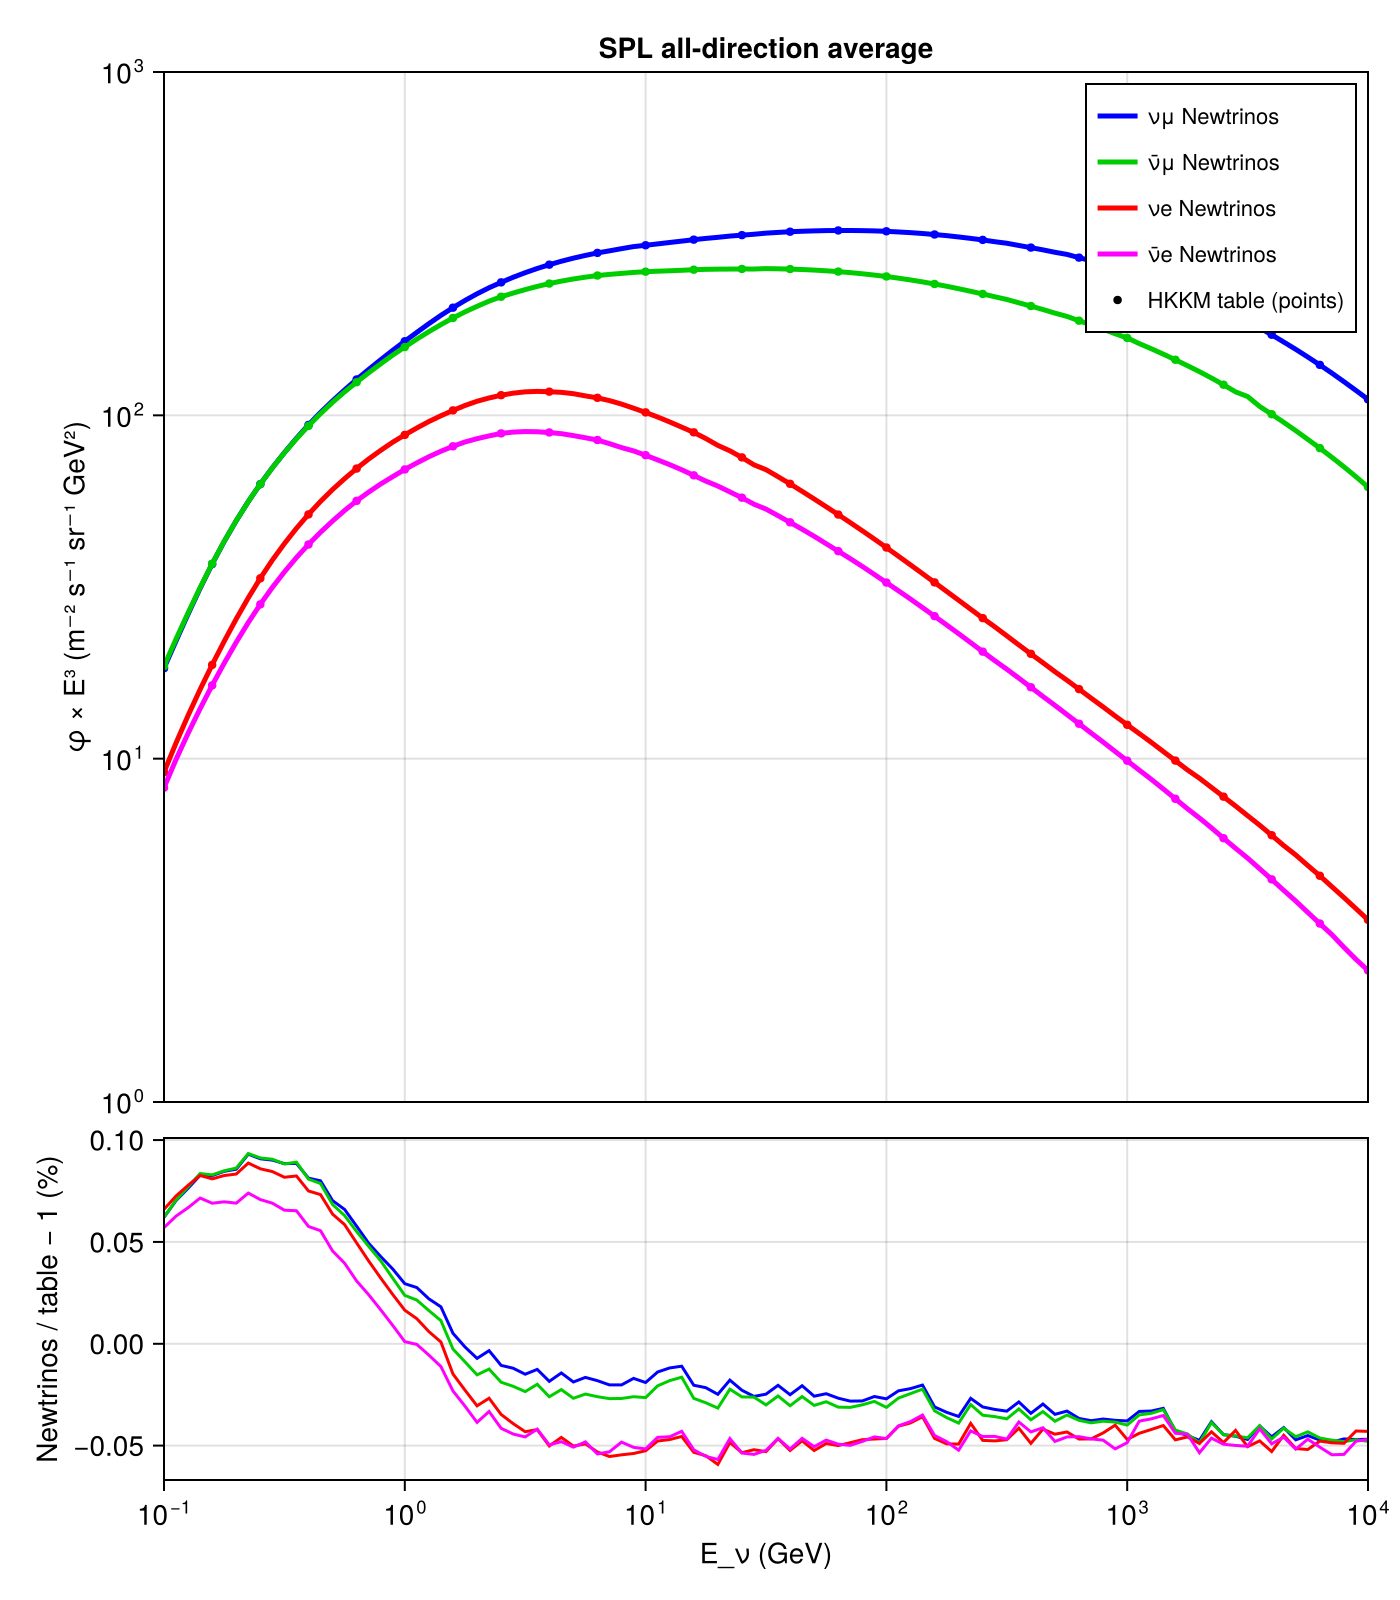
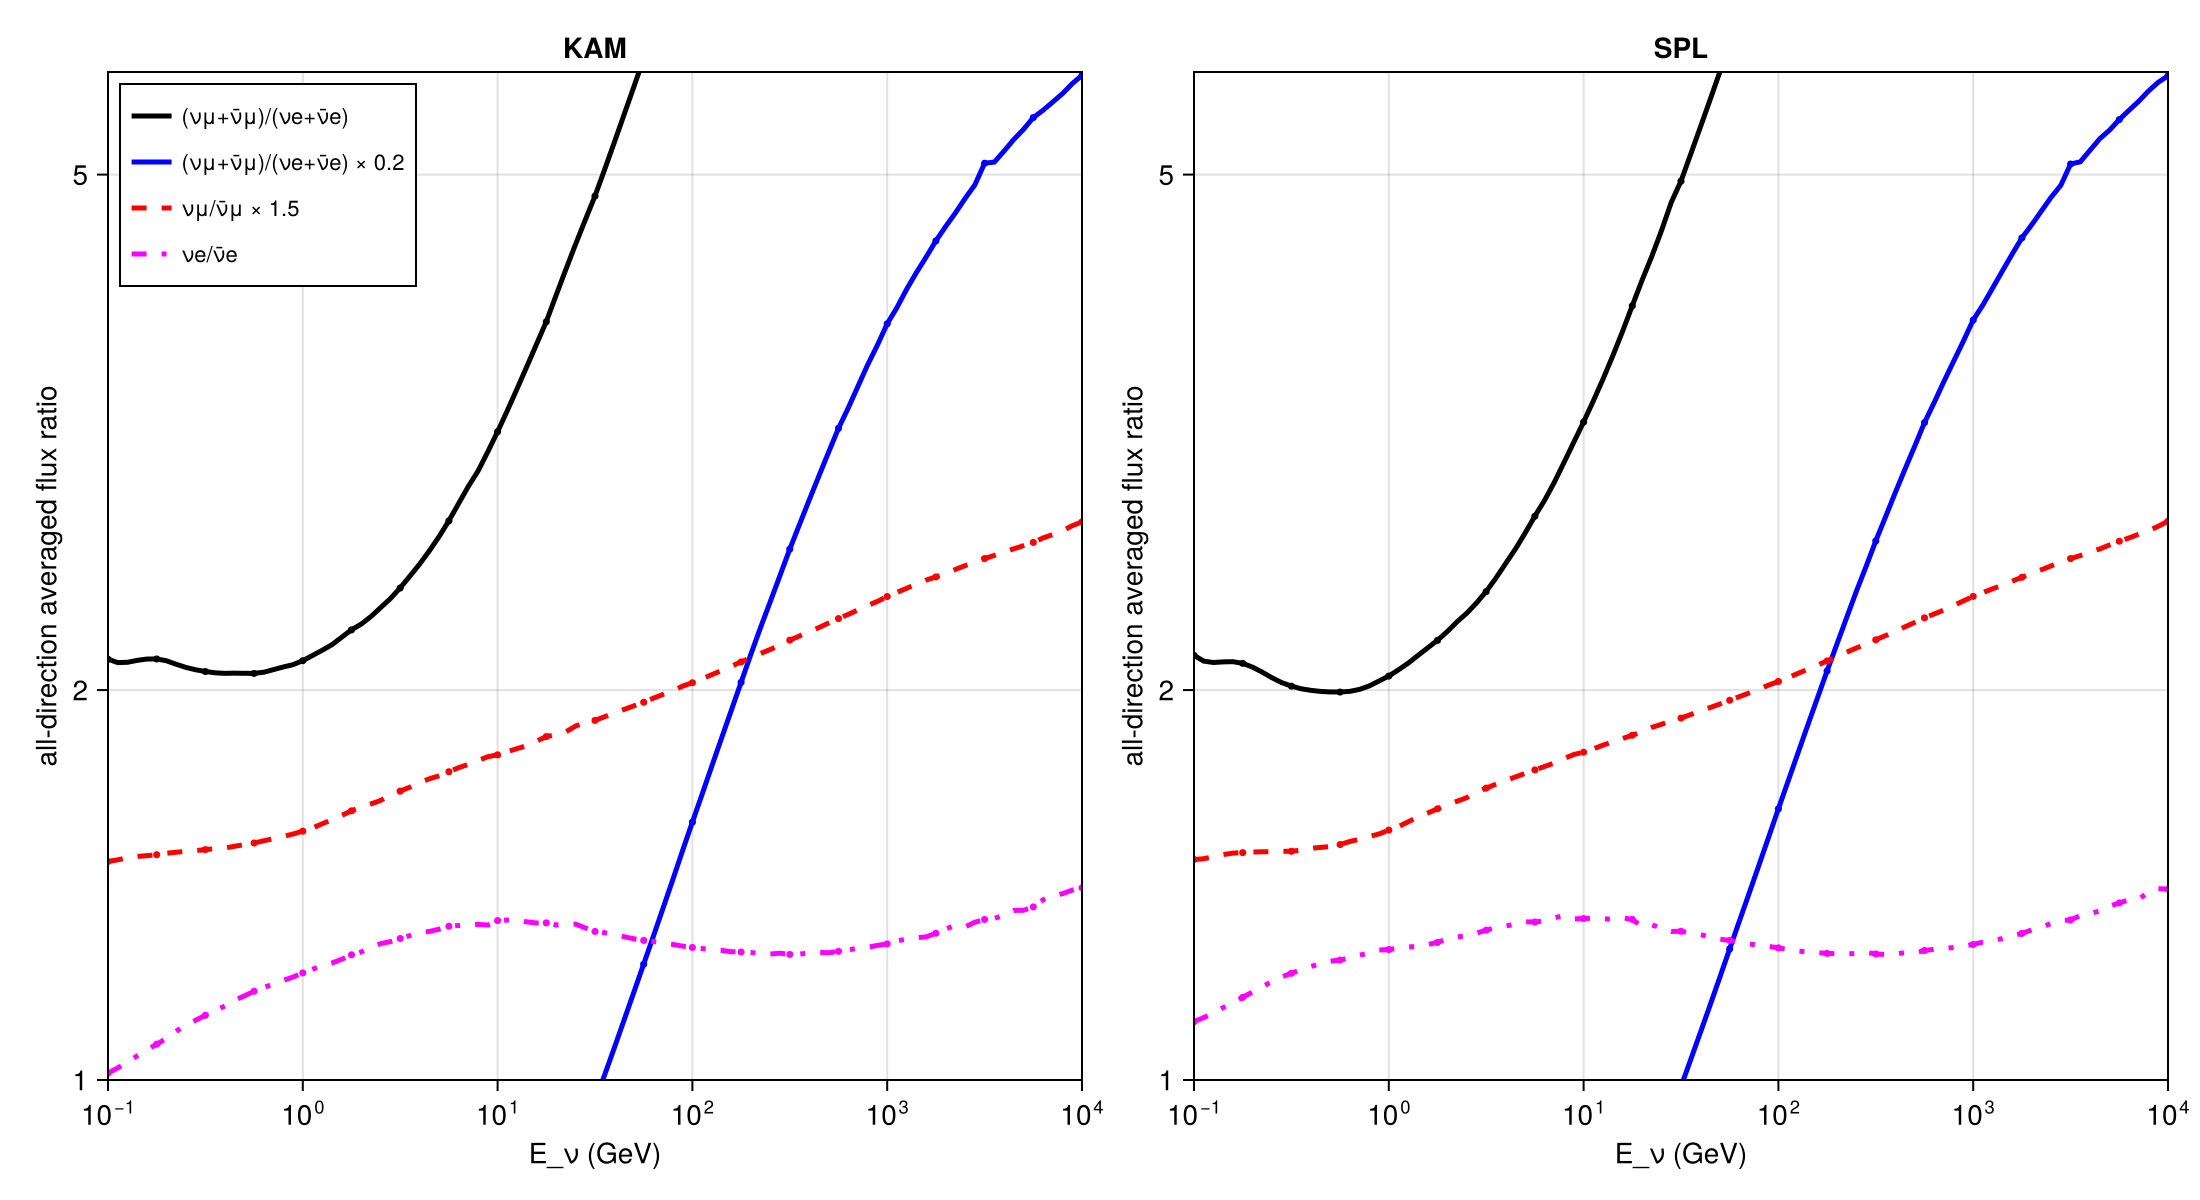
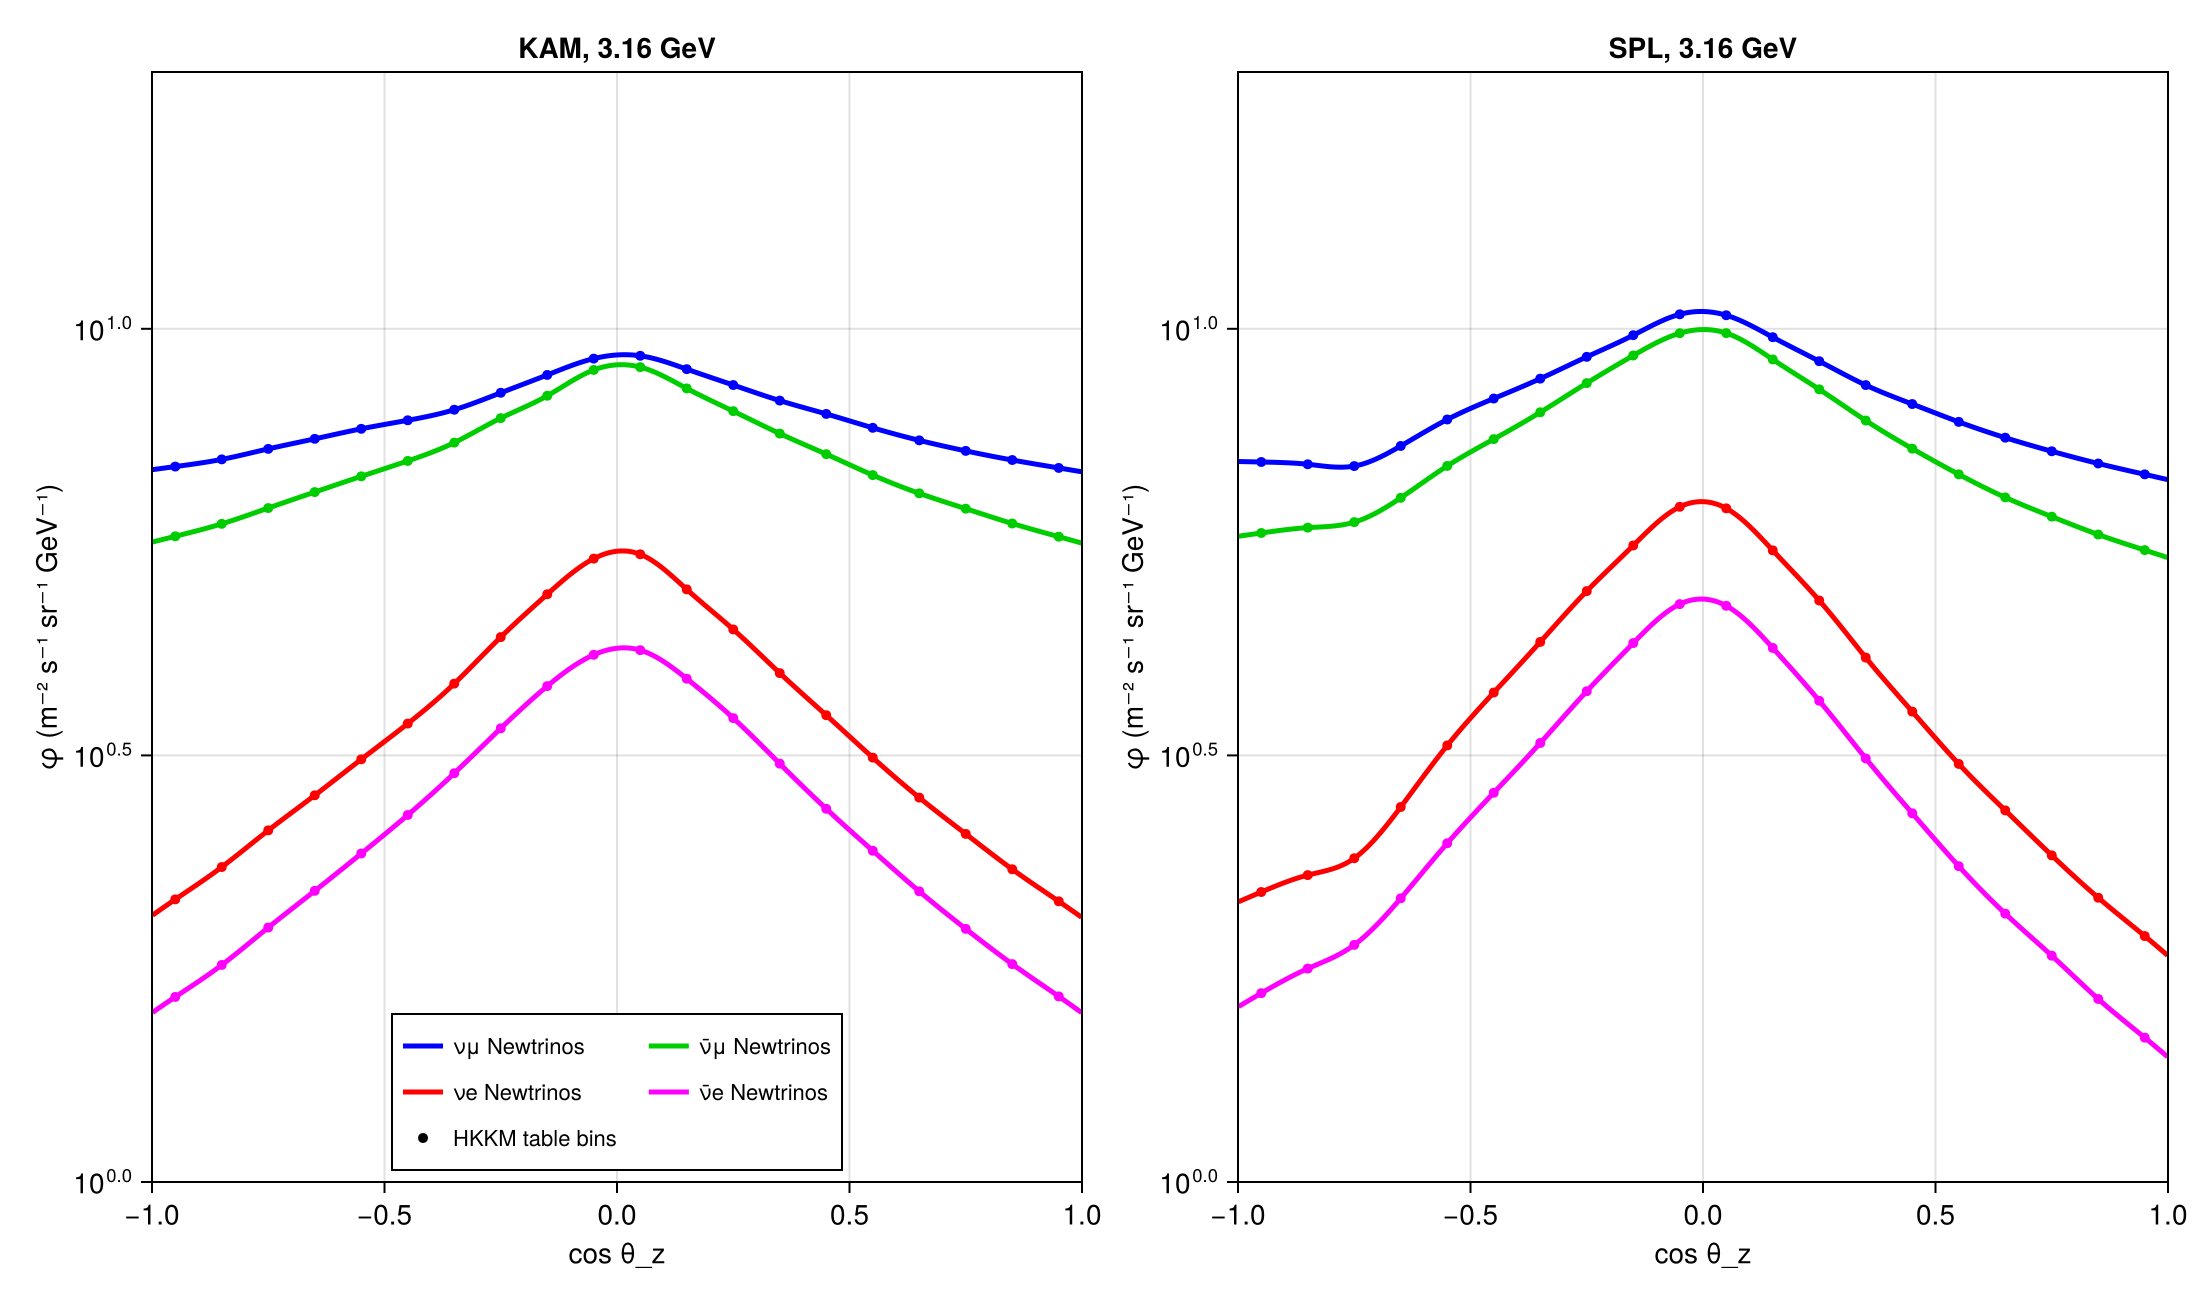
The nominal atmospheric neutrino flux of Newtrinos.jl (module atm_flux, HKKM model): fluxes evaluated from the Newtrinos splines are compared with the published HKKM tables at the Super-Kamiokande site (KAM) and the South Pole (SPL), as all-direction averages, flavour ratios and zenith-angle dependence.
Figures
All-direction averaged flux × E³, Super-Kamiokande site · Fig. 3 (KAM)
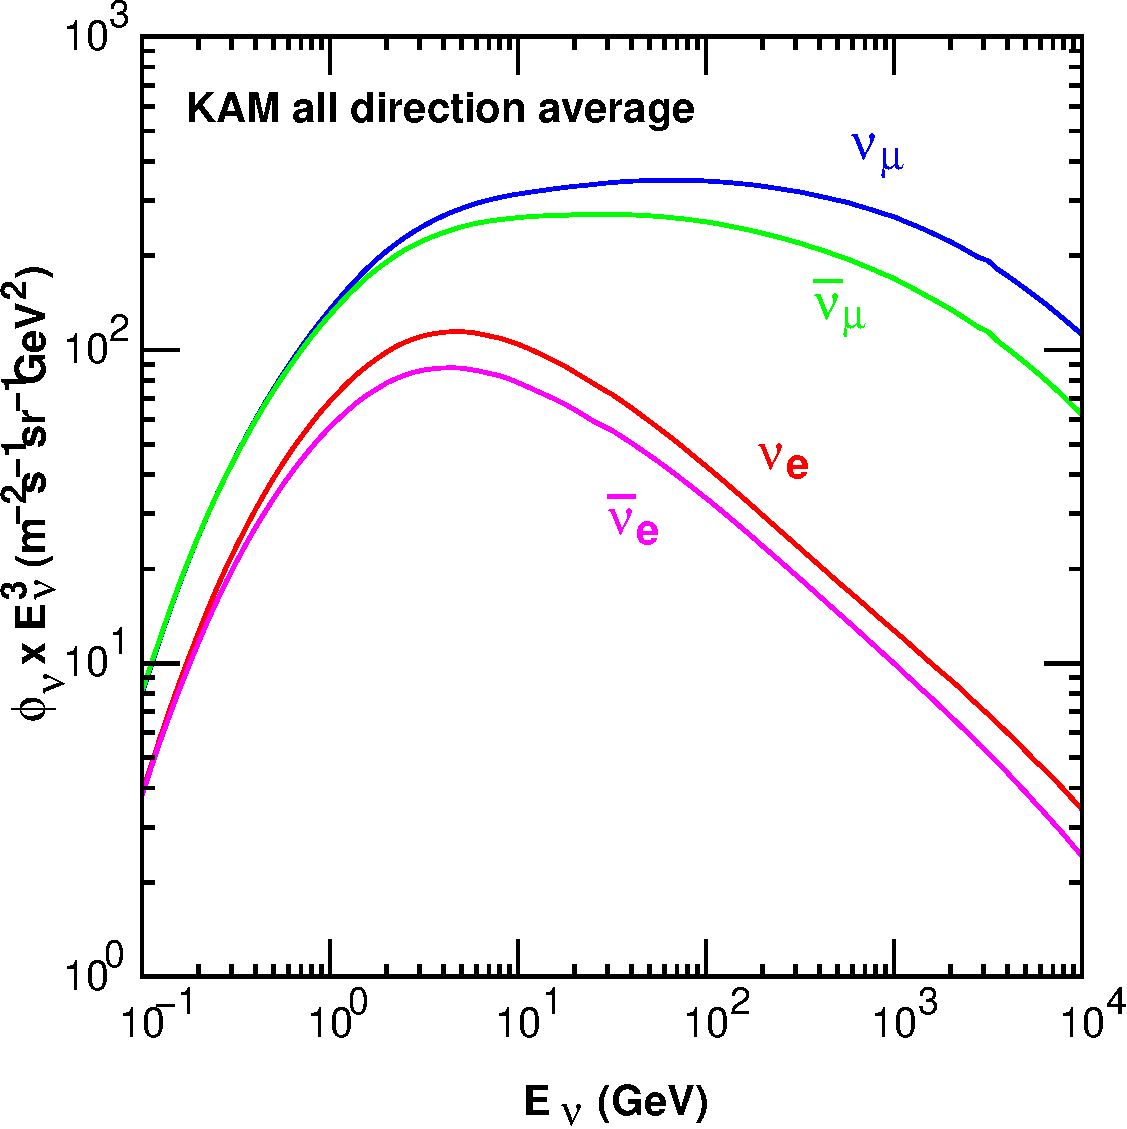
Original figure: M. Honda, M. Sajjad Athar, T. Kajita, K. Kasahara, S. Midorikawa, Phys. Rev. D 92, 023004 (2015), Fig. 3 (KAM), doi:10.1103/PhysRevD.92.023004. Not our work; shown for comparison, all rights with the authors and publisher.
All-direction averaged flux × E³, South Pole · Fig. 3 (SPL)
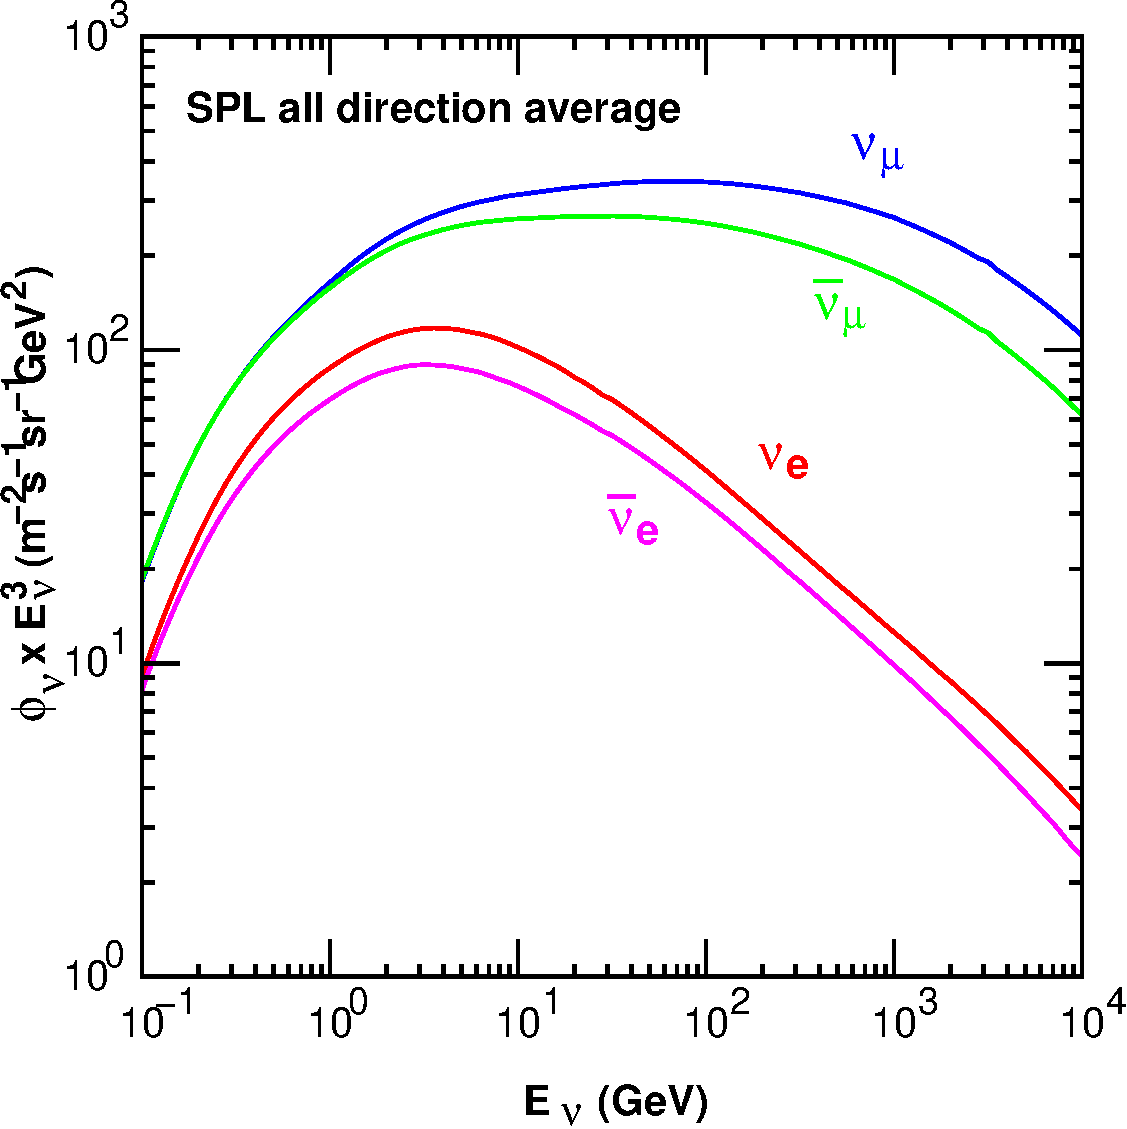
Original figure: M. Honda, M. Sajjad Athar, T. Kajita, K. Kasahara, S. Midorikawa, Phys. Rev. D 92, 023004 (2015), Fig. 3 (SPL), doi:10.1103/PhysRevD.92.023004. Not our work; shown for comparison, all rights with the authors and publisher.
Flavour ratios of the all-direction averaged flux · Fig. 5 (KAM, SPL)
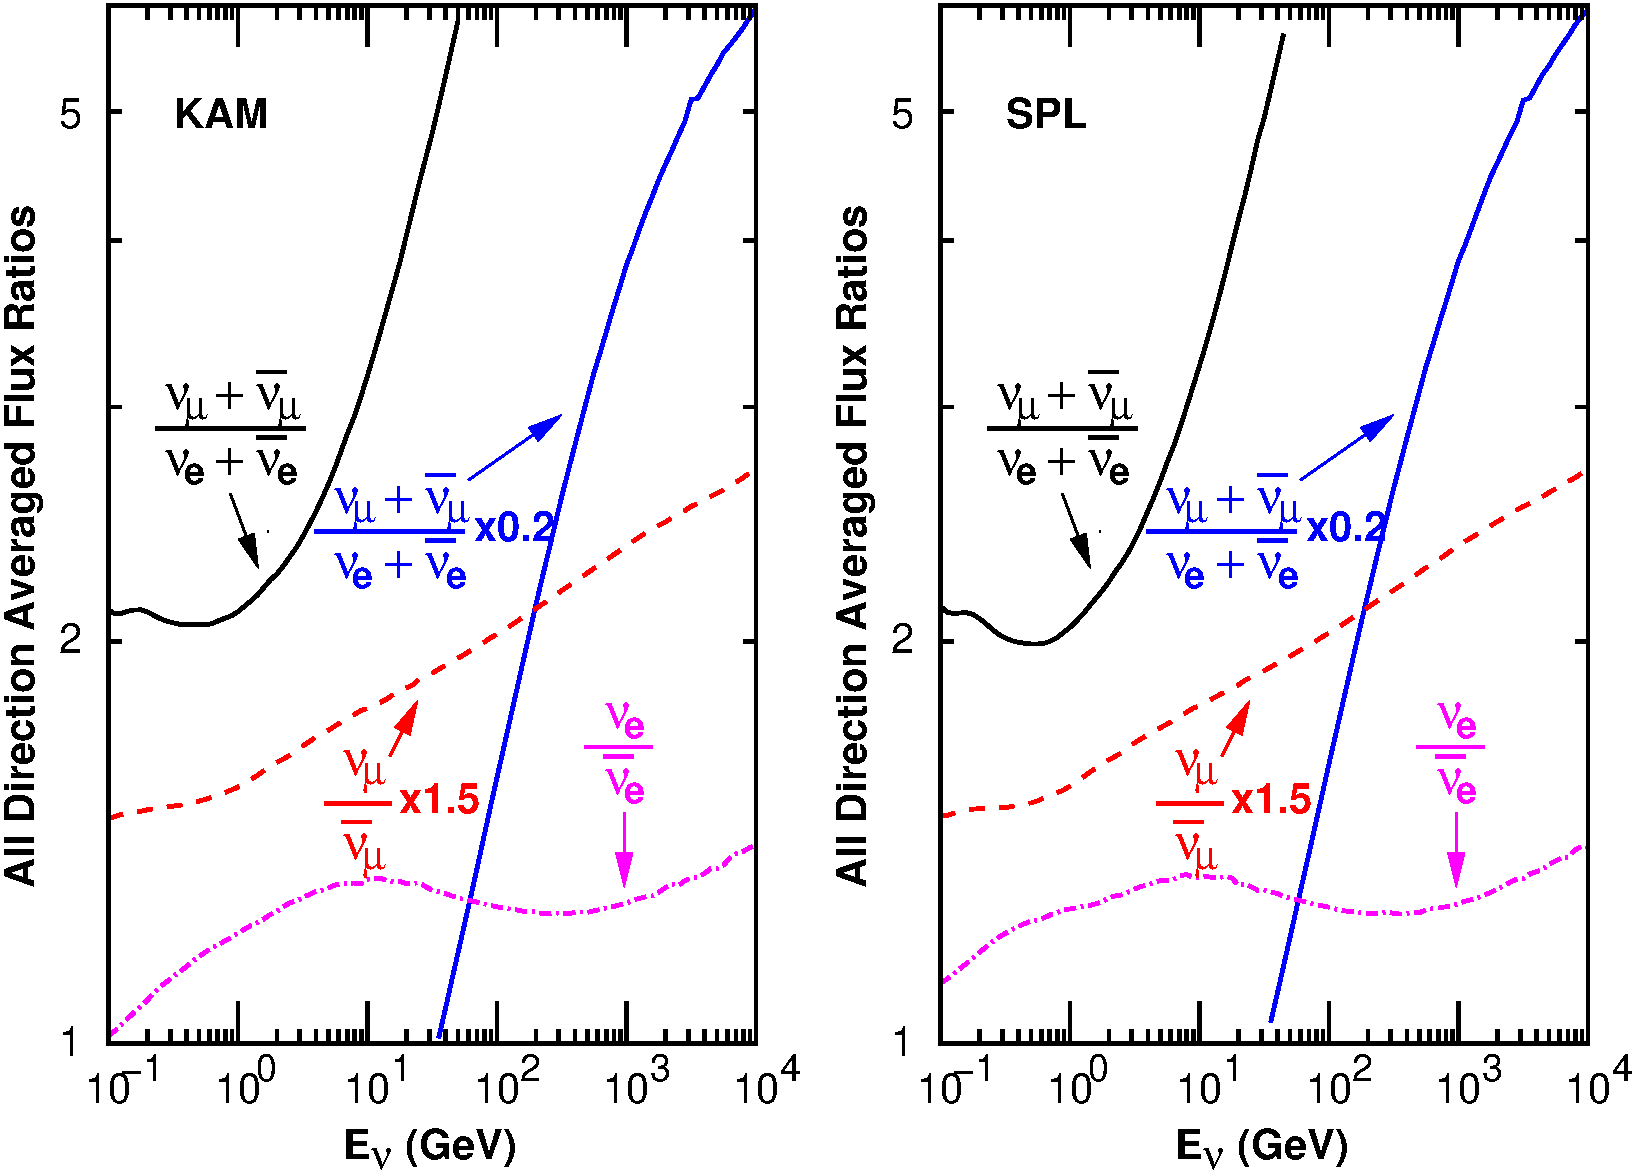
Original figure: M. Honda, M. Sajjad Athar, T. Kajita, K. Kasahara, S. Midorikawa, Phys. Rev. D 92, 023004 (2015), Fig. 5 (KAM, SPL), doi:10.1103/PhysRevD.92.023004. Not our work; shown for comparison, all rights with the authors and publisher.
Zenith-angle dependence at 3.2 GeV · Fig. 7 (KAM, SPL)
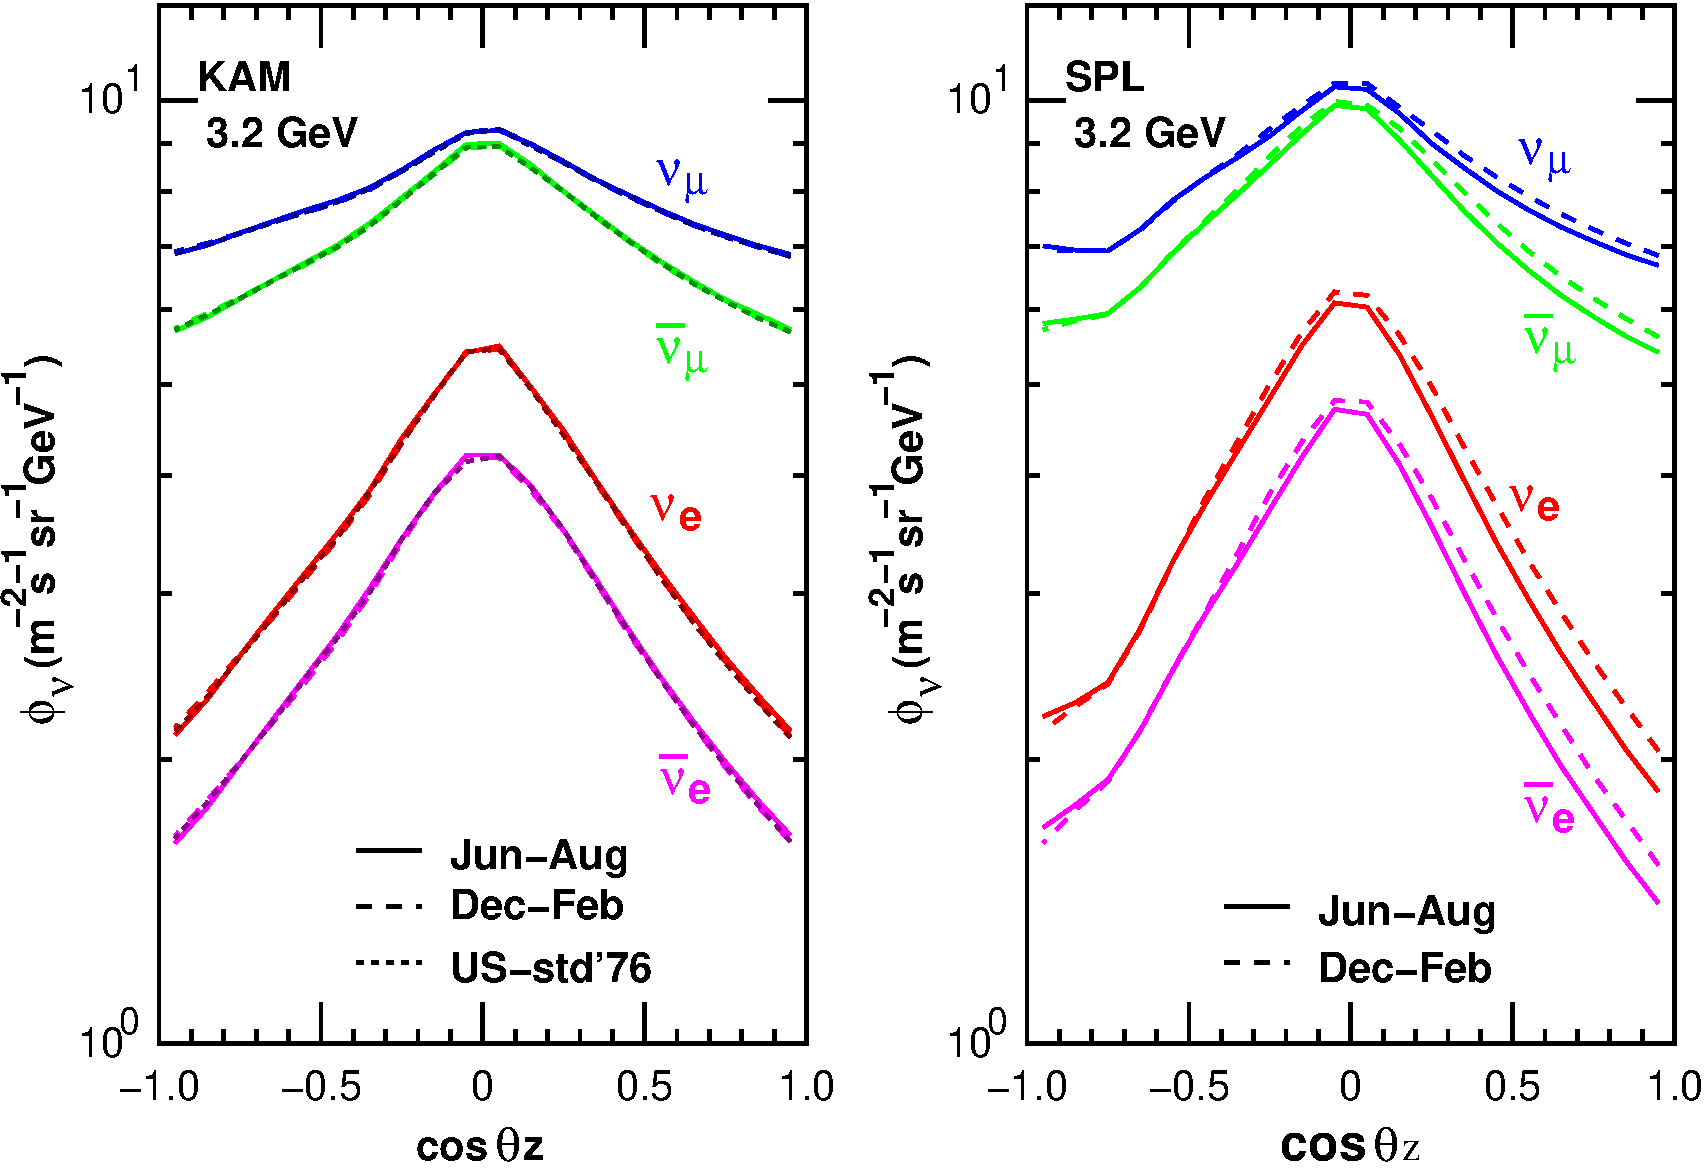
Original figure: M. Honda, M. Sajjad Athar, T. Kajita, K. Kasahara, S. Midorikawa, Phys. Rev. D 92, 023004 (2015), Fig. 7 (KAM, SPL), doi:10.1103/PhysRevD.92.023004. Not our work; shown for comparison, all rights with the authors and publisher.
Known limitations
- Uses the azimuth-averaged HKKM tables for solar minimum without mountain overburden (kam-ally-20-01-solmin.d, spl-nu-20-01-000.d); the paper's Fig. 3 is a one-year average and does not state the solar-activity choice, which matters only below ~1 GeV.
- The tables are read independently in reproduce.jl; Newtrinos (cubic splines in log₁₀E and cos θ_z) reproduces the all-direction averages to better than 0.1 % for all flavours at both sites.
- Azimuthal dependence (paper Figs. 8–11) is not modelled: Newtrinos uses azimuth-averaged tables.
Reproduce
git clone https://github.com/Newtrinos-org/Newtrinos.jl.git && cd Newtrinos.jl && git checkout de27463fde- Download reproduce.jl into an empty directory.
julia -t 8 --project=/path/to/Newtrinos.jl reproduce.jl
# Verification of the Newtrinos.jl atmospheric neutrino flux (module `atm_flux`, nominal HKKM model) against
# Honda et al., Phys. Rev. D 92, 023004 (2015) [arXiv:1502.03916].
# The HKKM flux tables (Honda's website) are read directly here, independently of Newtrinos, and compared with the
# fluxes Newtrinos evaluates from its splines.
# Run from this directory with the Newtrinos.jl environment at the pinned commit:
#   julia --project=<path to Newtrinos.jl> reproduce.jl
using Newtrinos, CairoMakie, CSV, DataFrames, DelimitedFiles, Printf

cd(@__DIR__); mkpath("ours"); mkpath("results")

const FLAVOURS = (:numu, :numubar, :nue, :nuebar)
const COLORS = (numu = :blue, numubar = :green3, nue = :red, nuebar = :magenta)
const LABELS = (numu = "νμ", numubar = "ν̄μ", nue = "νe", nuebar = "ν̄e")
const SITES = (KAM = "kam-ally-20-01-solmin.d", SPL = "spl-nu-20-01-000.d")   # azimuth-averaged, 20 cos θ_z bins, solar minimum

# independent reader of an HKKM table: 20 blocks (cos θ_z from 1.0 down to −1.0, 0.1 wide), 101 energies each
function read_hkkm(file)
    lines = readlines(joinpath(pkgdir(Newtrinos), "src/physics", file))
    blocks = []
    i = 1
    while i <= length(lines)
        if startswith(lines[i], "average flux in")
            m = match(r"cosZ =\s*([-\d.]+)\s*--\s*([-\d.]+)", lines[i])
            cz = (parse(Float64, m[1]) + parse(Float64, m[2])) / 2
            rows = [parse.(Float64, split(lines[j])) for j in i+2:i+102]
            push!(blocks, (cz = cz, E = getindex.(rows, 1), φ = NamedTuple{FLAVOURS}(Tuple(getindex.(rows, k) for k in 2:5))))
            i += 103
        else
            i += 1
        end
    end
    sort(blocks, by = b -> b.cz)
end

results = Dict()
for (site, file) in pairs(SITES)
    blocks = read_hkkm(file)
    E = blocks[1].E
    # table: all-direction average = mean over the 20 equal-width cos θ_z bins
    table_avg = NamedTuple{FLAVOURS}(Tuple([sum(b.φ[f][k] for b in blocks) / length(blocks) for k in eachindex(E)] for f in FLAVOURS))
    # Newtrinos: spline-interpolated flux integrated over cos θ_z ∈ [−1, 1]
    flux = Newtrinos.atm_flux.configure(Newtrinos.atm_flux.AtmFluxConfig(nominal_model = Newtrinos.atm_flux.HKKM(fname = file)))
    cz = collect(range(-0.9995, 0.9995, 1000))
    t = flux.nominal_flux(E, cz)
    newtrinos_avg = NamedTuple{FLAVOURS}(Tuple(vec(sum(reshape(getproperty(t, f), length(E), length(cz)), dims = 2)) ./ length(cz) for f in FLAVOURS))
    # zenith dependence at the table energy closest to 3.2 GeV
    k3 = argmin(abs.(E .- 3.1623))
    czf = collect(range(-0.999, 0.999, 400))
    tz = flux.nominal_flux([E[k3]], czf)
    results[site] = (; E, table_avg, newtrinos_avg, blocks, k3, czf, zen = NamedTuple{FLAVOURS}(Tuple(getproperty(tz, f) for f in FLAVOURS)))
    CSV.write("results/hkkm_$(site)_alldir.csv", DataFrame(:E_GeV => E,
        [Symbol("table_$f") => table_avg[f] for f in FLAVOURS]..., [Symbol("newtrinos_$f") => newtrinos_avg[f] for f in FLAVOURS]...))
    @printf("%s: max |Newtrinos / table − 1| of the all-direction average: %s\n", site,
            join(["$(LABELS[f]) $(round(100 * maximum(abs.(newtrinos_avg[f] ./ table_avg[f] .- 1)), digits = 2)) %" for f in FLAVOURS], ", "))
end

# --- Fig. 3: all-direction averaged flux × E³ ---
for site in keys(SITES)
    r = results[site]
    fig = Figure(size = (700, 800))
    ax = Axis(fig[1, 1], xscale = log10, yscale = log10, ylabel = "φ × E³ (m⁻² s⁻¹ sr⁻¹ GeV²)", title = "$(site) all-direction average")
    ax2 = Axis(fig[2, 1], xscale = log10, xlabel = "E_ν (GeV)", ylabel = "Newtrinos / table − 1 (%)")
    for f in FLAVOURS
        lines!(ax, r.E, r.newtrinos_avg[f] .* r.E .^ 3, color = COLORS[f], linewidth = 2.5, label = "$(LABELS[f]) Newtrinos")
        scatter!(ax, r.E[1:4:end], (r.table_avg[f] .* r.E .^ 3)[1:4:end], color = COLORS[f], markersize = 6)
        lines!(ax2, r.E, 100 .* (r.newtrinos_avg[f] ./ r.table_avg[f] .- 1), color = COLORS[f])
    end
    scatter!(ax, [NaN], [NaN], color = :black, markersize = 6, label = "HKKM table (points)")
    xlims!(ax, 0.1, 1e4); ylims!(ax, 1, 1e3); xlims!(ax2, 0.1, 1e4)
    linkxaxes!(ax, ax2); hidexdecorations!(ax, grid = false); rowsize!(fig.layout, 2, Relative(0.25))
    axislegend(ax, position = :rt, labelsize = 11)
    save("ours/fig3_alldir_$(lowercase(string(site))).png", fig)
end

# --- Fig. 5: flavour ratios of the all-direction averages ---
fig = Figure(size = (1100, 600))
for (i, site) in enumerate(keys(SITES))
    r = results[site]; n = r.newtrinos_avg; tb = r.table_avg
    ax = Axis(fig[1, i], xscale = log10, yscale = log10, xlabel = "E_ν (GeV)", ylabel = "all-direction averaged flux ratio", title = string(site),
              yticks = [1, 2, 5])
    for (num, den, sc, c, ls, lab) in (((:numu, :numubar), (:nue, :nuebar), 1.0, :black, :solid, "(νμ+ν̄μ)/(νe+ν̄e)"),
                                         ((:numu, :numubar), (:nue, :nuebar), 0.2, :blue, :solid, "(νμ+ν̄μ)/(νe+ν̄e) × 0.2"),
                                         ((:numu,), (:numubar,), 1.5, :red, :dash, "νμ/ν̄μ × 1.5"),
                                         ((:nue,), (:nuebar,), 1.0, :magenta, :dashdot, "νe/ν̄e"))
        ratio(x) = sc .* sum(x[f] for f in num) ./ sum(x[f] for f in den)
        lines!(ax, r.E, ratio(n), color = c, linestyle = ls, linewidth = 2.5, label = lab)
        scatter!(ax, r.E[1:5:end], ratio(tb)[1:5:end], color = c, markersize = 5)
    end
    xlims!(ax, 0.1, 1e4); ylims!(ax, 1, 6)
    i == 1 && axislegend(ax, position = :lt, labelsize = 11)
end
save("ours/fig5_ratios.png", fig)

# --- Fig. 7: zenith dependence at 3.2 GeV ---
fig = Figure(size = (1100, 650))
for (i, site) in enumerate(keys(SITES))
    r = results[site]
    ax = Axis(fig[1, i], yscale = log10, xlabel = "cos θ_z", ylabel = "φ (m⁻² s⁻¹ sr⁻¹ GeV⁻¹)", title = "$(site), $(round(r.E[r.k3], digits = 2)) GeV")
    for f in FLAVOURS
        lines!(ax, r.czf, r.zen[f], color = COLORS[f], linewidth = 2.5, label = "$(LABELS[f]) Newtrinos")
        scatter!(ax, [b.cz for b in r.blocks], [b.φ[f][r.k3] for b in r.blocks], color = COLORS[f], markersize = 7)
    end
    scatter!(ax, [NaN], [NaN], color = :black, markersize = 7, label = "HKKM table bins")
    xlims!(ax, -1, 1); ylims!(ax, 1, 20)
    i == 1 && axislegend(ax, position = :cb, labelsize = 11, nbanks = 2)
end
save("ours/fig7_zenith_3GeV.png", fig)
Provenance
| Newtrinos.jl commit | de27463fde (atm_flux (HKKM)) |
|---|---|
| Run date | 2026-10-05T07:03:45Z |
| Wall time | 0.5 min (4 threads) |
| Julia | 1.13.0 |
| Machine | 13th Gen Intel(R) Core(TM) i7-13700H, 20 hardware threads, Linux |
| Environment | newtrinos_Manifest.toml · run.toml |
Downloads
CSV files hold one row per scan point: the scanned and profiled parameters
(sin2_theta23, dm2_32 in eV², dcp in rad, nuisance parameters), dchi2 = −2Δ log L
and the log-likelihood. JLD2 files contain the full NewtrinosResult objects.
| File | Size | SHA-256 |
|---|---|---|
| ours/fig3_alldir_kam.png | 241.7 kB | a67b31de1b0a… |
| ours/fig3_alldir_spl.png | 205.9 kB | bcd9da3c464e… |
| ours/fig5_ratios.png | 155.0 kB | f981b617ab7c… |
| ours/fig7_zenith_3GeV.png | 194.8 kB | 944484e525de… |
| results/hkkm_KAM_alldir.csv | 15.3 kB | dce19d5c71af… |
| results/hkkm_SPL_alldir.csv | 15.1 kB | 2bc2010dc75a… |